
What happened to global carbon emissions this year?
Emissions from fossils are up, emissions from land use are down.

Today, the Global Carbon Project released its latest annual budget, with projections of how emissions have changed this year.
The GCP is an amazing team of researchers and analysts who not only track and estimate the latest emissions from around the world, but also produce open datasets dating back to 1750 and put a lot of effort into making this work understandable for non-experts.
This is their 20th anniversary, so as an avid user of their work: thank you. It is essential work that often goes under the radar and doesn’t receive the credit it deserves.
Anyway, let’s get on with their new projections for 2025.
This is just a quick summary of the key trends and results. You can find more charts and analysis from Robbie Andrew, one of the co-authors (who does beautiful charts and analysis from a range of climate and energy datasets).
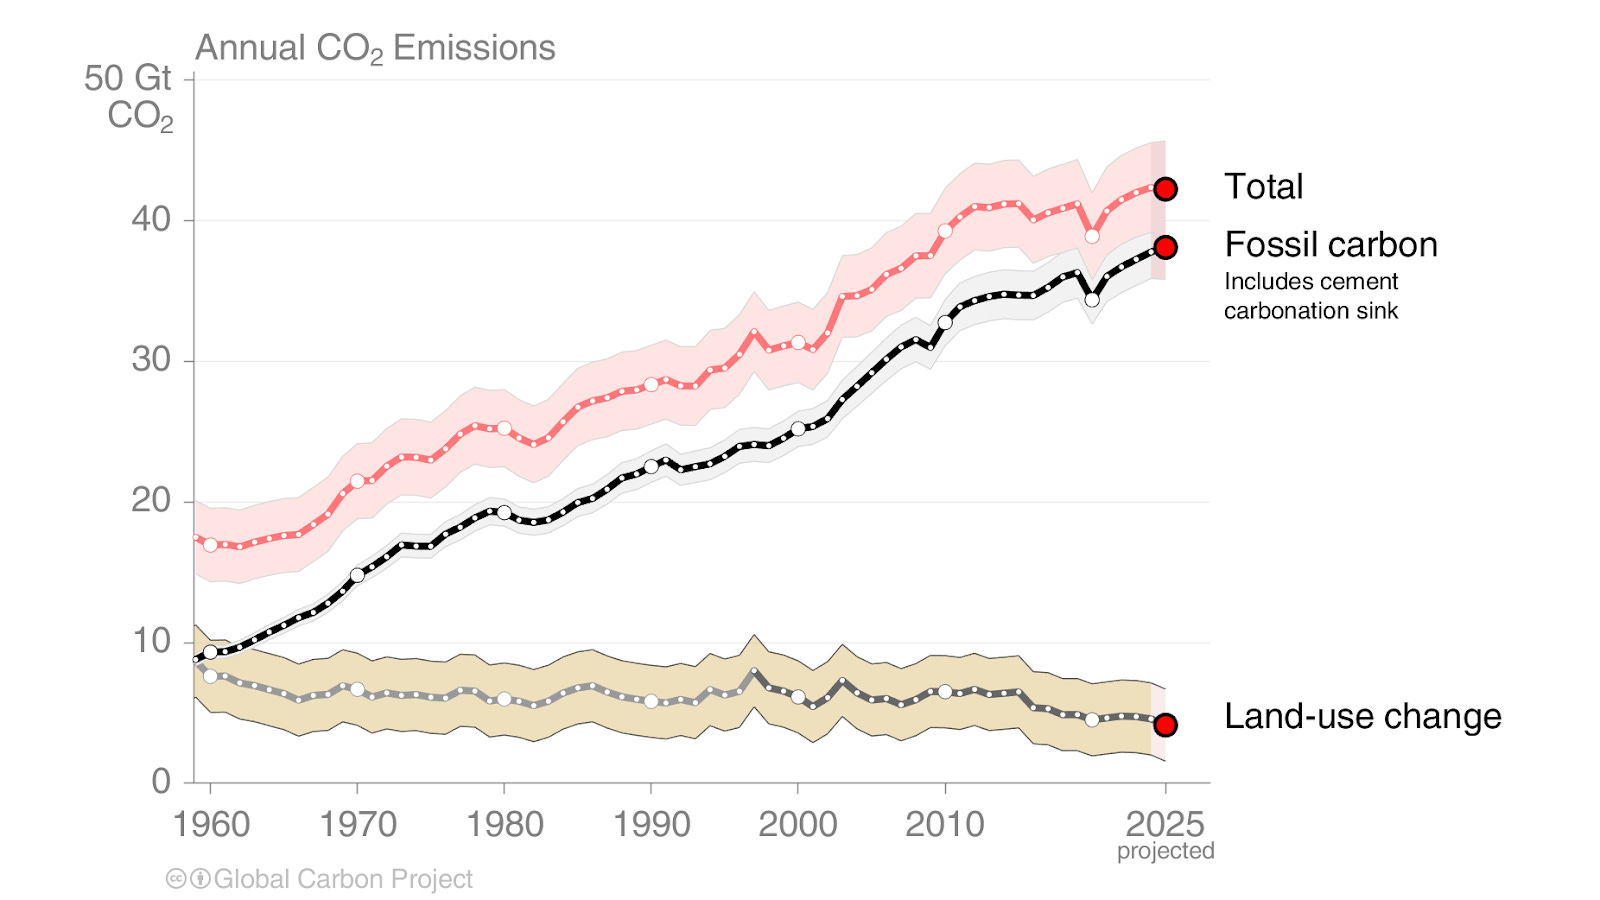
Global fossil CO2 emissions increased, while land use change declined
CO2 emissions are typically split into two categories: fossil emissions and land use. Fossil emissions are primarily the emissions from burning fossil fuels, as well as industrial processes such as cement production.
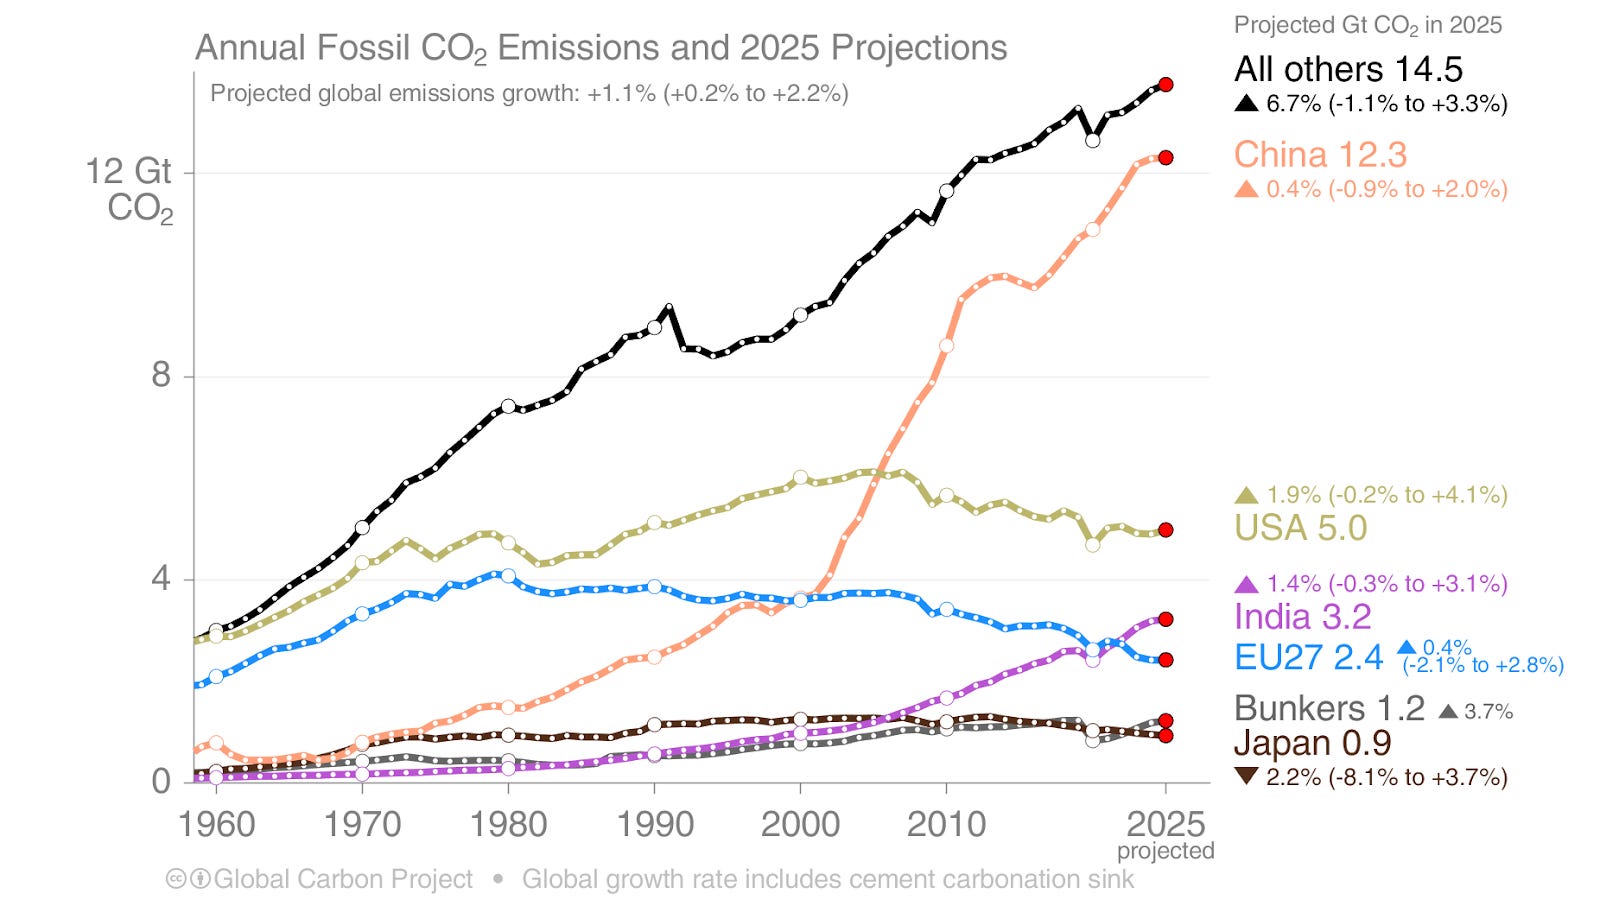
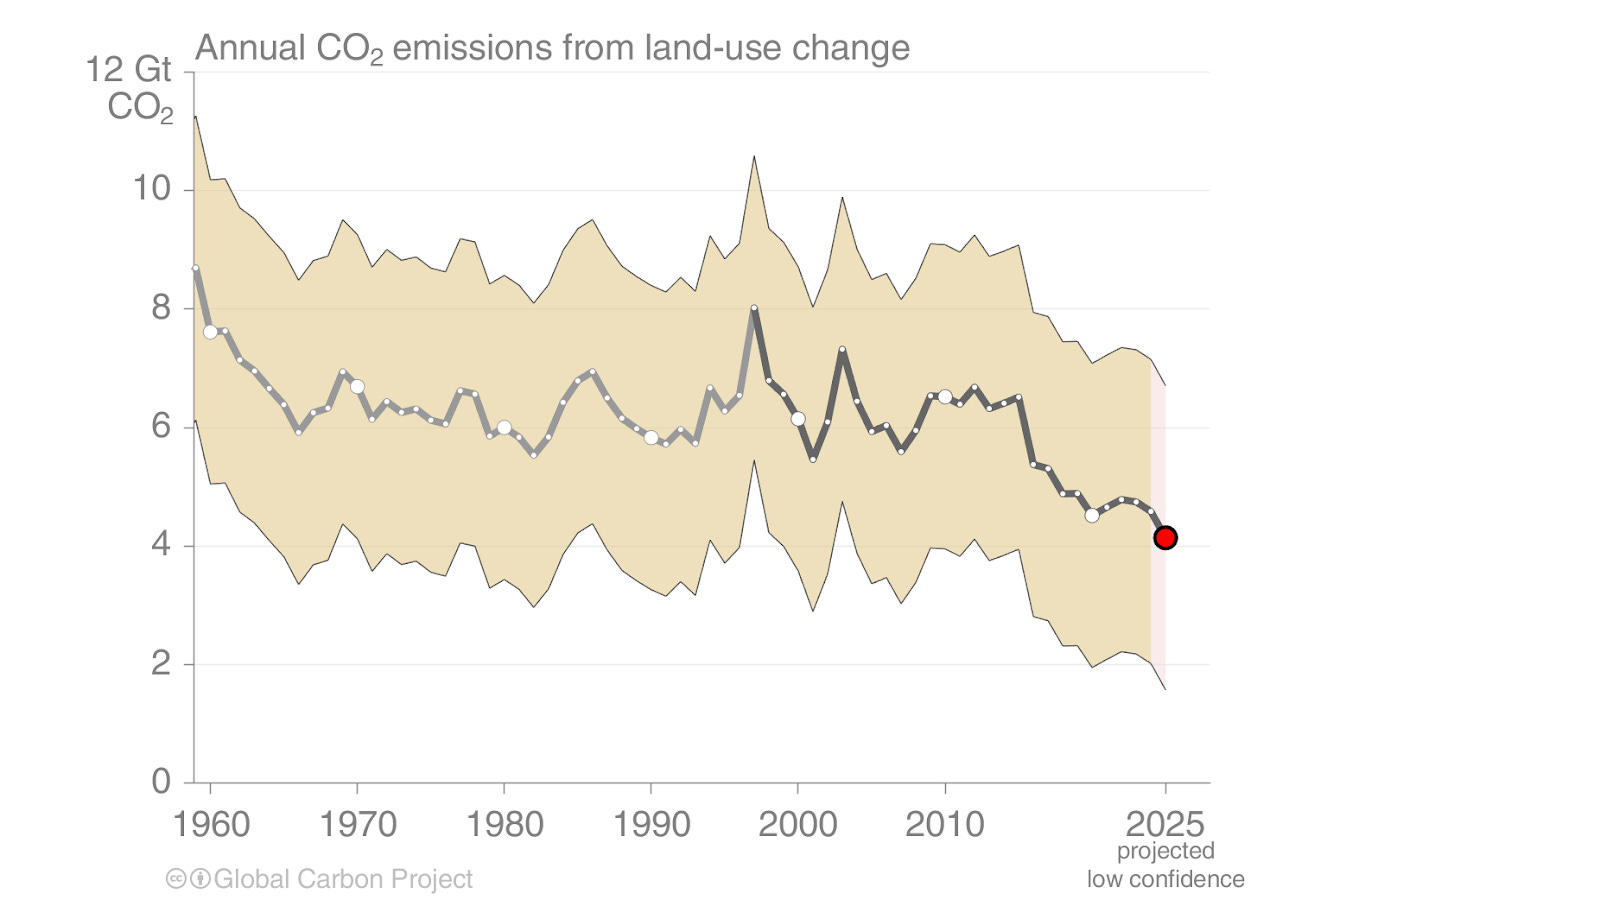
In 2025, GCP projects that fossil emissions increased by around 1%, while those from land use change decreased. You can see this in the chart below.
The drop from land use change was offset by the increase in fossil carbon, so total emissions were very similar to last year — or might even be a small drop — at around 42 billion tonnes.
All of these projections come with some uncertainty, not least because the year isn’t finished (and was even less so when researchers were preparing it). Land use change emissions tend to be more uncertain, as they’re harder to track and quantify.
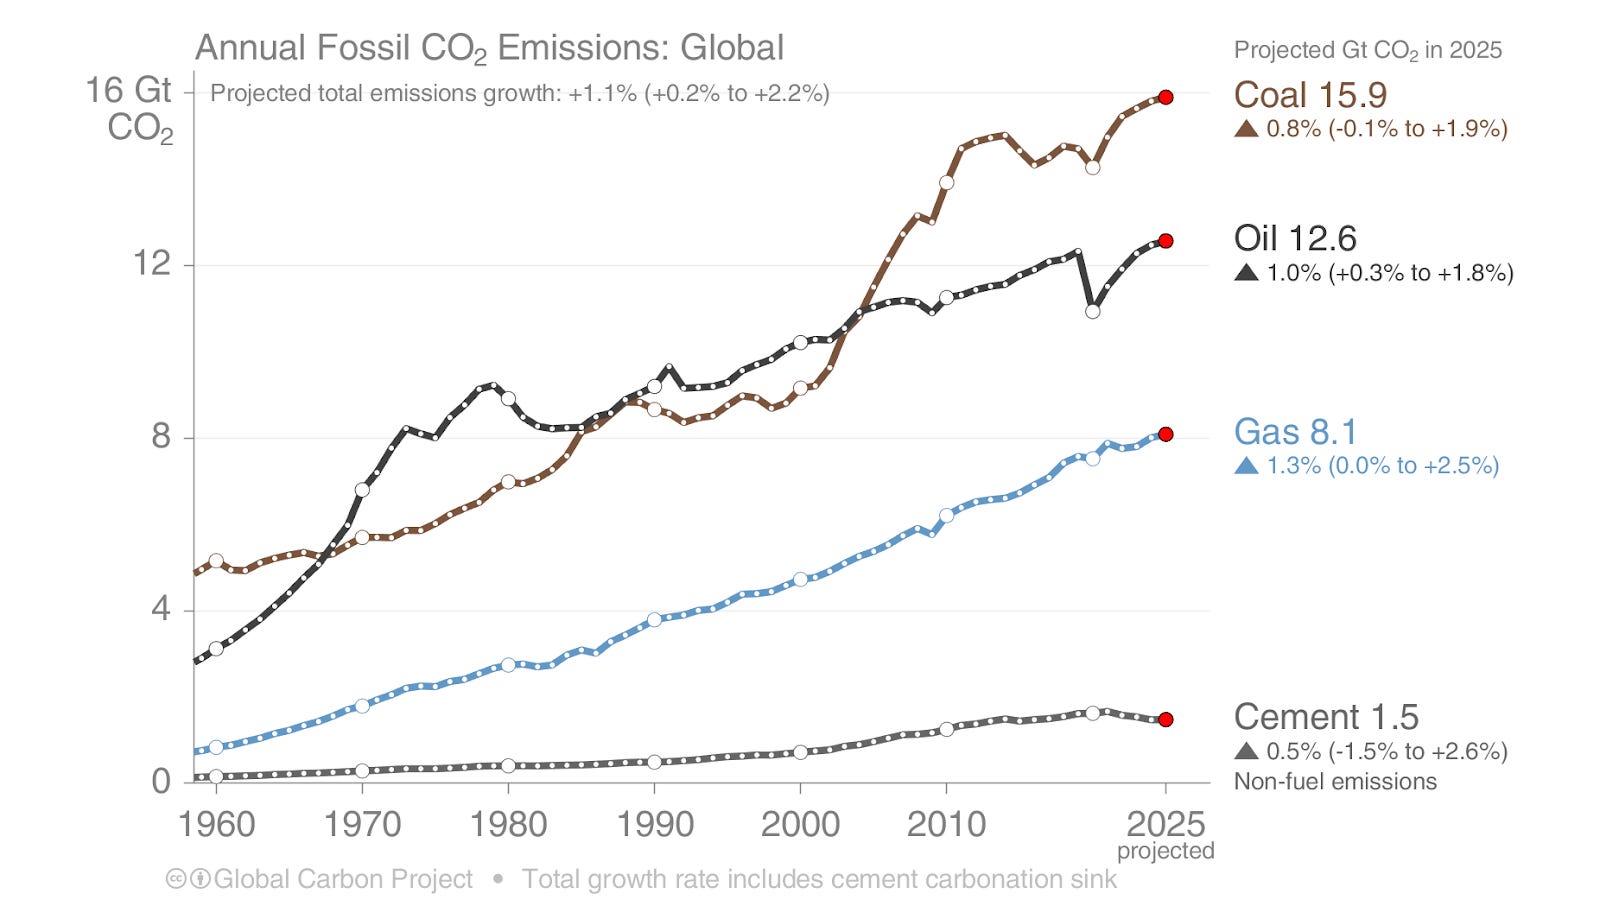
Fossil emissions increased by around 1%
The GCP projects that fossil emissions will increase this year by around 1% (with uncertainty ranging from 0.2% to 2.2%). This is obviously not what we want; global emissions at this stage should really be going down. As I’ll come on to later, the implications of this for 1.5°C are obvious.
In the chart, you can see the projected change in emissions from each source in the last year.
All fuels increased, although there was much weaker growth for coal and cement, which increased by less than 1%.
What do we expect from the major emitters?
I expect everyone wants to see estimates for China, so here they are. GCP projects its emissions to increase by 0.4%. That’s pretty low, and is a positive signal that a peak is approaching.
The authors do note that: “Given the uncertainty range, a decrease in emissions is also a possibility — confirmation will require full-year data, expected in 2026.”
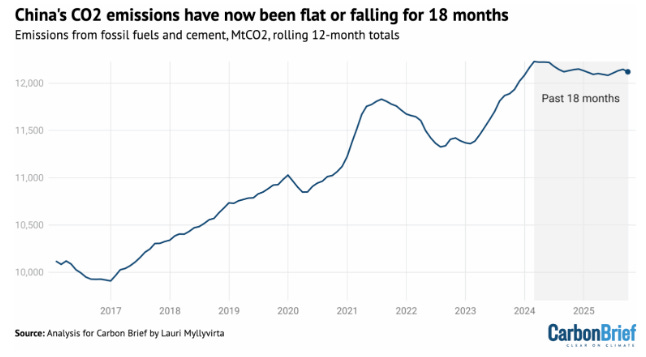
This is closely aligned with recent analysis from Lauri Myllyvirta, published in Carbon Brief. He showed that China’s emissions had been flatlining (or were slightly down) over the last 18 months. But he noted that:
“After the third quarter of 2025, it is clear that the plateau or slow decline of China’s CO2 emissions that started in early 2024 continues.
Whether emissions increased or decreased marginally in the first three quarters of the year is too close to call, given the uncertainties involved, but a drop in full-year emissions became much more likely after September, which recorded an approximately 3% drop in emissions year-on-year.
Still, either a small increase or decrease in the calendar year of 2025 remains possible and will be ultimately be decided by developments in the fourth quarter.”
The GCP’s breakdown is shown in the chart below. Its growth in coal emissions was very small: a medium estimate of just 0.3% (again, there is some chance they actually fell). Growth in oil and gas was fairly strong, but cement emissions declined.
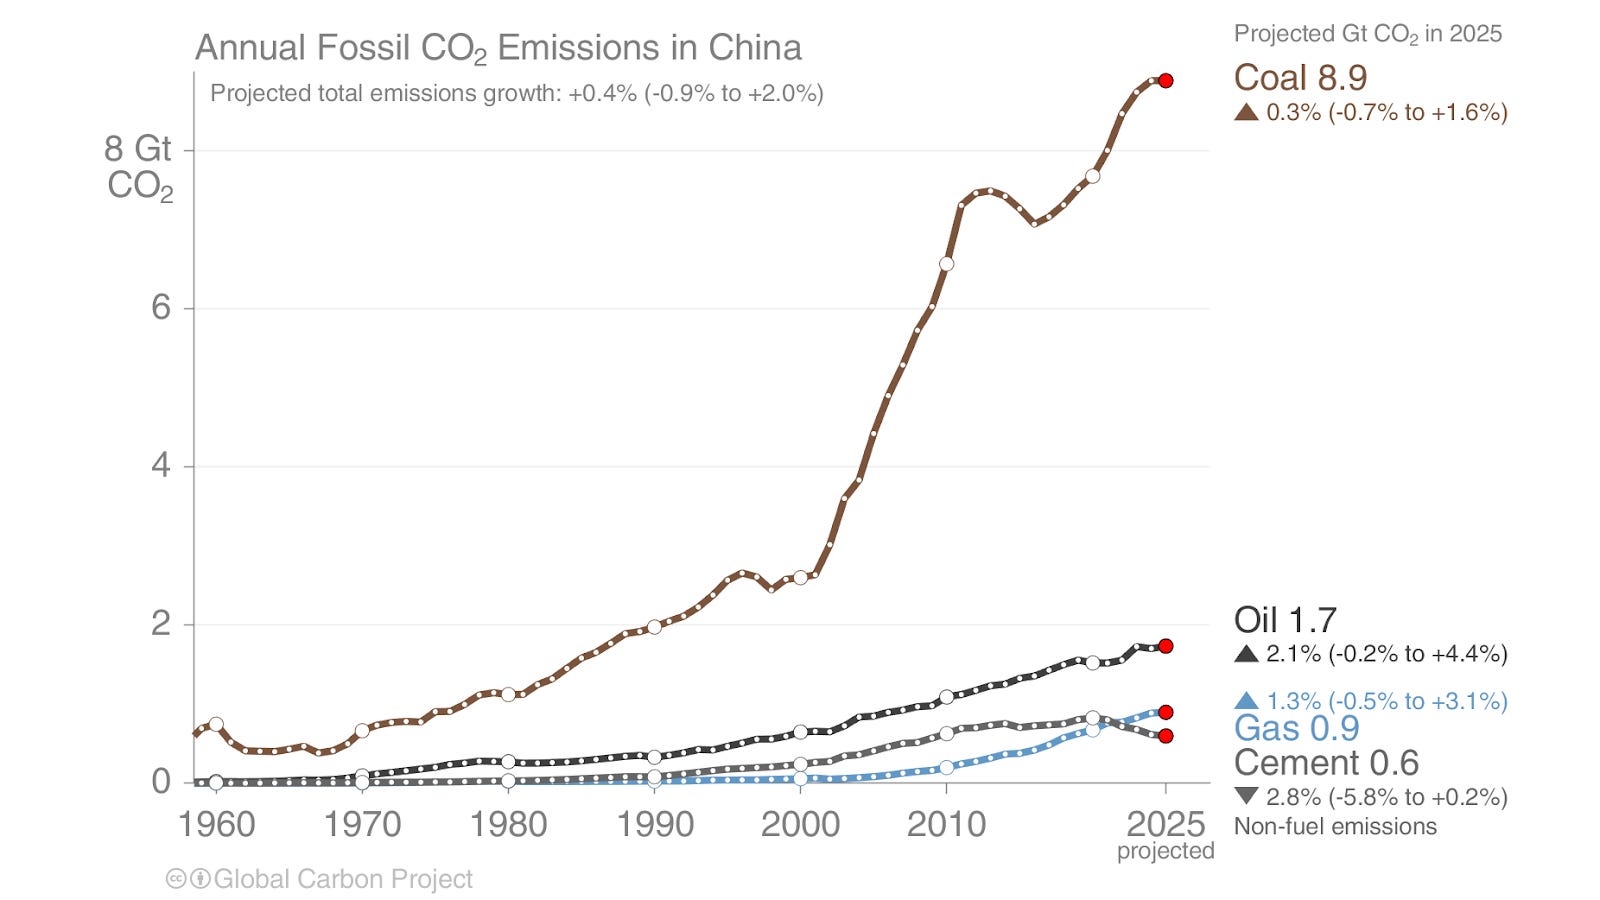
Why has China’s growth been much lower this year, in particular for coal?
Two things. Growth in power demand was lower than expected, and it deployed huge amounts of solar and wind. That means clean power made up basically all of this growth in demand, and very little additional coal was needed to fill in the gap.
For emissions to go down, clean power needs to make up the additional demand and then some, so that it pushes existing coal out of the mix.
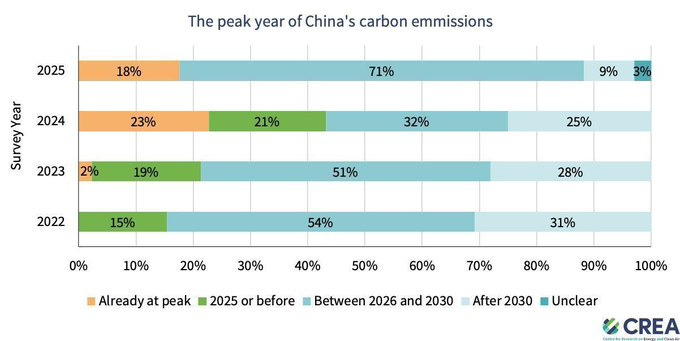
Predicting China’s definitive peak is hard. The chart below shows what experts think. Most now expect it to be sometime between 2026 and 2030.
What about the other big emitters?
Emissions in both the US and the EU are expected to increase this year, which goes against their long-term trend towards decline. Although the EU increase is marginal at this point, and could end up being a plateau. The GCP attribute most of this to unfavourable weather conditions and high gas prices.
In the US, emissions from coal increased. It would be tempting to say that was because of the direct promotion of coal from Donald Trump (after all, he has backed America’s “beautiful, clean coal”), but it’s actually indirect policy choices that caused it to increase. The administration promoted higher exports of liquified natural gas (LNG). That drove up domestic gas prices in the US, and when gas prices are high, coal is more economically competitive. A colder start to the year also increased heating demands.
The EU struggled with weather constraints. Both hydropower and wind power output were lower than expected, so gas was used to fill the deficit. As the GCP says: “Given the uncertainty range centred around zero, the increase should not be overinterpreted and will need to be confirmed when full-year data are available.” Nonetheless, even a stagnation in emissions is disappointing given the long-term trend.
India’s emissions will grow, but at a lower rate than in previous years, and lower than many expected. An early monsoon cooled temperatures slightly, reducing demand for air conditioning and cooling. Very strong growth in renewables also meant that the increase in coal consumption was very low.
Finally, Japan’s emissions fell by around 2%. It has been bringing some of its nuclear plants back online (after closing them following Fukushima), and has also been expanding its solar capacity. This is pushing coal back out of the mix.
Land use change emissions fell
One of the positives from this year’s budget is the expected fall in land use emissions. Again, these emissions are much harder to estimate than fossil ones, but there are several reasons why we would expect emissions to be falling.
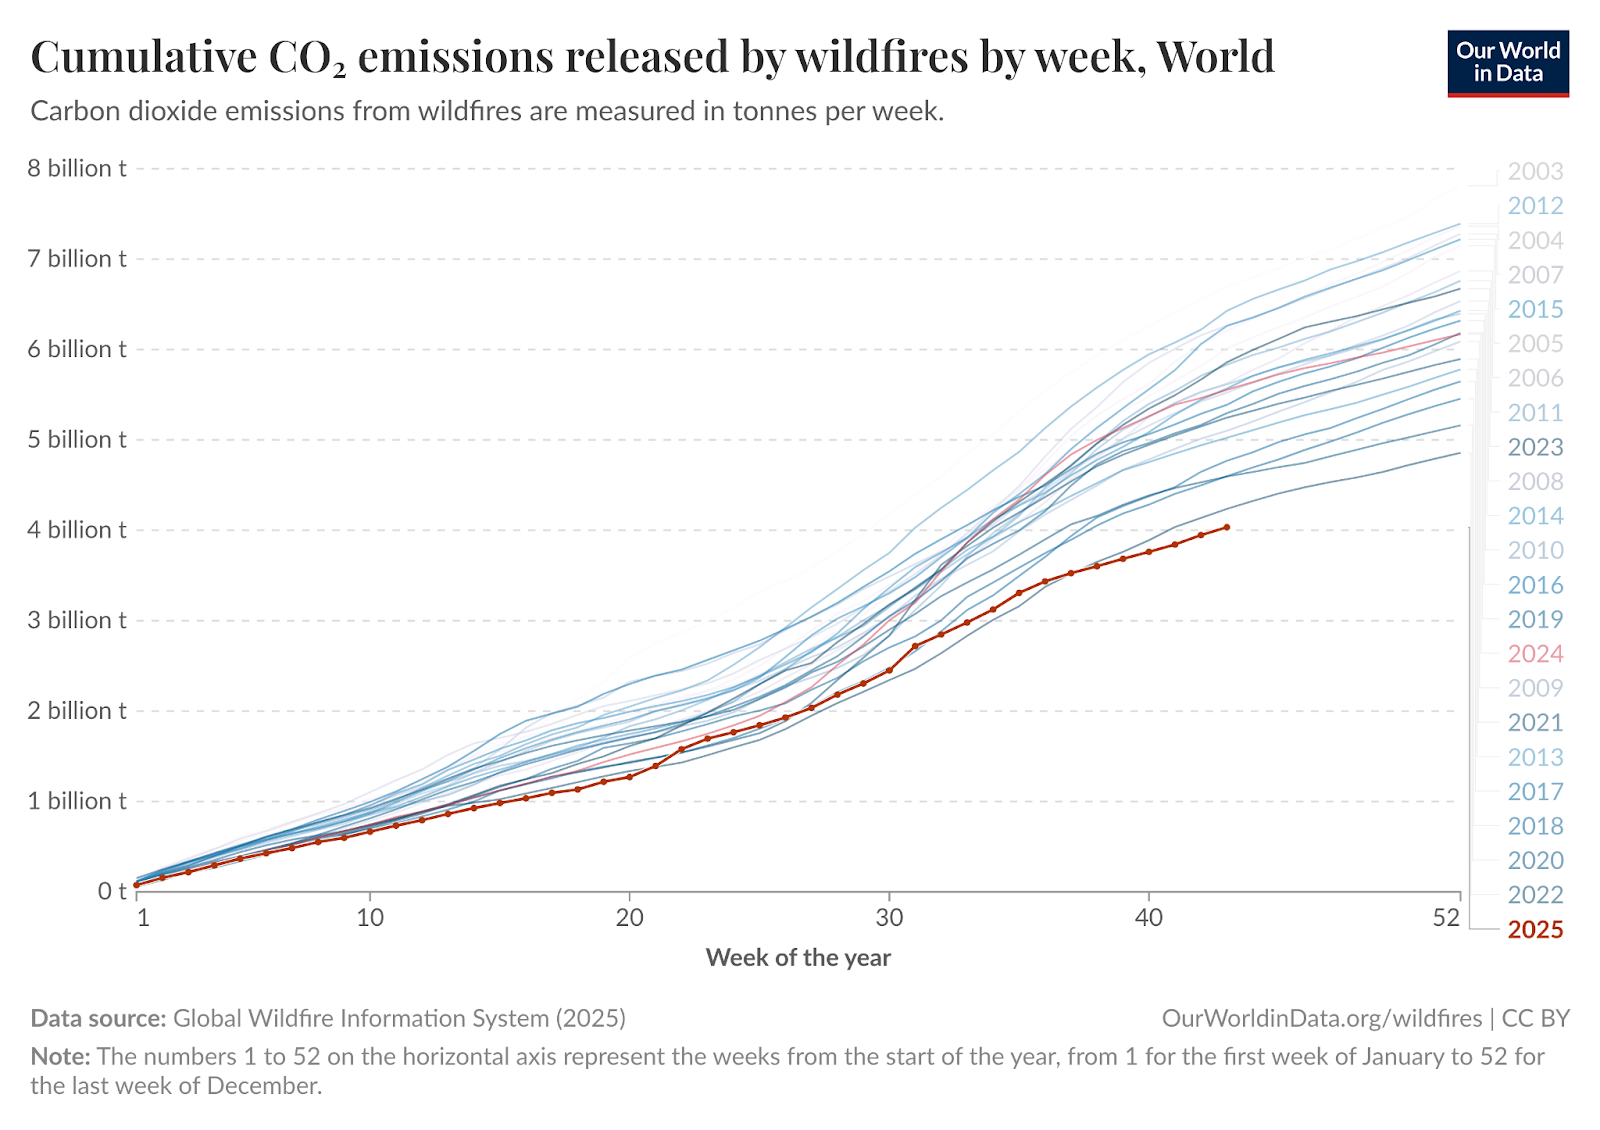
Global wildfires have been less intense than in previous years, both in terms of area burned and carbon emitted. In the chart below, you can see that 2025 emissions are tracking below previous years based on data from the Global Wildfire Information System.
Deforestation has also been falling in a number of large countries. My last post covered the latest drop in deforestation in the Brazilian Amazon.
1.5°C is clearly dead
The growth in global emissions has slowed significantly over the last decade compared to previous ones. This year, total emissions (including land use change) might have stagnated. But not by much, and fossil emissions still increased.
My point is that, at best, we’re getting stuck at an extremely high plateau. If we were to do amazingly well next year, the best we could hope for is a modest drop in global emissions. Instead of them being 42 billion tonnes, they’d be 40 or 41 billion. This rate of decline can — and will need to — speed up over time, but we’re still at the slow stage of turning the huge ship around.
That matters a lot when we’re talking about the 1.5°C target. I’ve said it before, and I’ll say it again: it’s not going to happen. The maths simply doesn’t work.
Below, I’ve made a chart showing the estimated remaining “carbon budget” — from Forster et al. (2025) and the IPCC AR6 report — to keep global temperatures below certain levels. This is based on a 50% likelihood of doing so: if we wanted to guarantee we stay below it, the budgets are obviously smaller.
I’ve put this in the context of current annual emissions, which are 42 billion tonnes. For 1.5°C, we have four years left before the budget is exhausted. Now, if we reduce emissions, we obviously extend this timeframe, but my point is that in the next 4 years, the declines will be too small to make much of a dent.
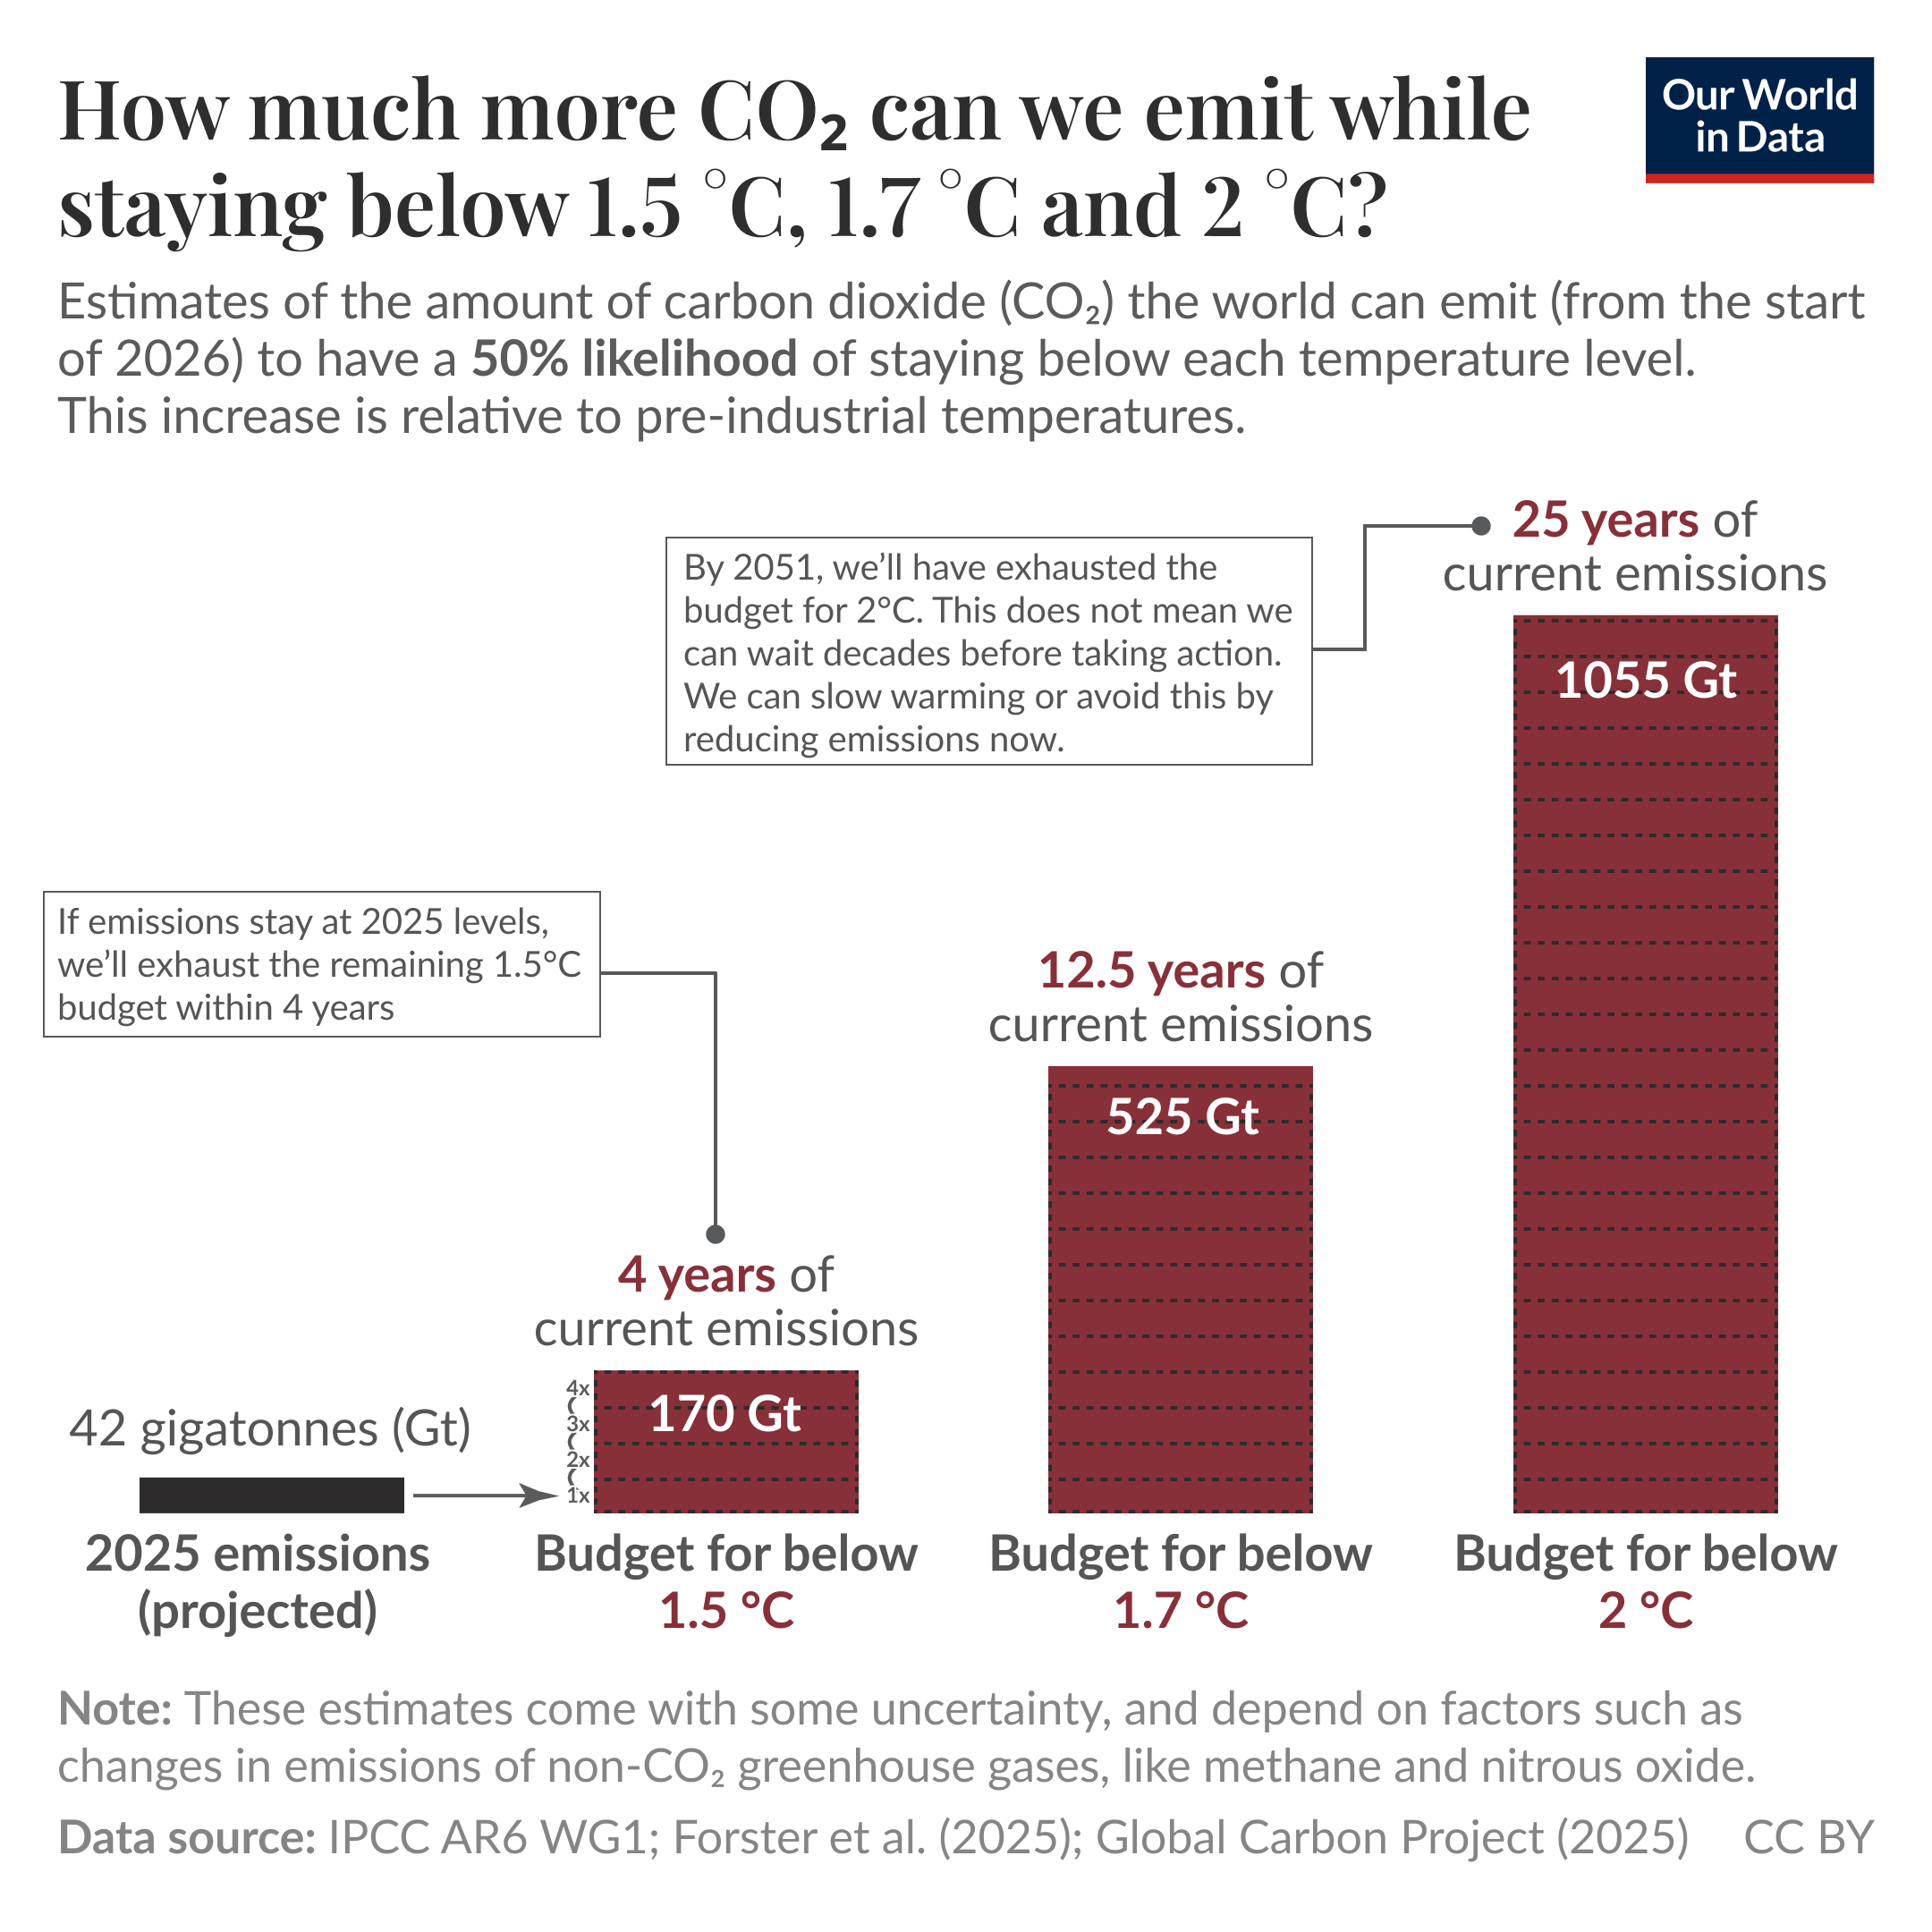
To extend this time from 4 to 5 years (which makes very little difference at all), average emissions across those years would need to be 34 billion tonnes. We are not going to cut global emissions by 20% in such a short timeframe. I am a fairly optimistic person, but there is just no way that’s happening (absent some global catastrophe).
The reality is that we will not cut emissions fast enough to avoid 1.5°C. But 2°C is still very much to play for. It will require a big step up in the world’s efforts (we’re currently headed for 2.5°C to 3°C under current policies), but if we get going, there is still some chance that we can limit warming to those levels. And as I always emphasise, even if we marginally fail, those efforts will in no way be wasted. 2.1°C means fewer impacts than 2.3°C, which means fewer impacts than 2.5°C.
If you want to explore the latest budget from the Global Carbon Project in more detail, here are some resources to check out:
Robbie Andrew makes fantastic and extremely clear visualisations.
At Our World in Data, we just updated all of our CO₂ emissions data with the latest (it includes all 2024 data, but not 2025 projections).
Thanks for the insightful overview, Hannah. I believe that the data supports voices within the EU to slacken the aggressive emission cuts that were all the rage before the pandemic. The EU nowadays contributes only 6.3% of fossil fuel emissions, with the ratio being lower every year. Even if we cut aggressively, we would have a comparably small overall impact - but this aggressive cut would mean economic devastation, since the EU economies are very export-oriented and therefore have to be competitive on world markets, which is very difficult when energy costs are much higher than in other parts of the world. I believe that a poorer EU would probably be dirtier, not cleaner, since we would lack the funds to drive the buildout of renewables forward. Please note that I'm not saying that the EU already does everything it could - I believe that, for example, we could do much more to build onshore wind and put PV on every last roof and battries in every house and that it would probably be a good idea to offer this to citizens for zero down payment and with subsidized loans, which people can pay to a large degree with the money they save on energy costs.
Hannah, thank you for this well written article. You and the Global Carbon project conduct detailed analysis of the CO2-warming problem, but not the clear solution -- Sustainability by Nuclear. Two, related problems must and can be solved. 1) Nuclear power plants are too costly and take too long to build. 2) Public 'common knowledge' that nuclear power radiation causes deadly cancer creates deep fear of radiation; vote-seeking politicians and their regulators create thickets of rules, increase costs, delay construction, or prohibit nuclear anything. It is perfectly feasible for nuclear power plants to generate firm, reliable electricity that is cheaper than from coal, cheaper than from LNG, and competitive with pipeline-supplied natural gas. We've done this before, before regulators declared all radiation is potentially deadly. Can you and your colleagues please turn your attention to analysis of the fraud and disinformation about radiation effects? Simply by exporting truth and removing barriers, we can solve this CO2-warming problem without subsidies, without taxes, using private enterprise to build on the economics intrinsic to the high energy density of uranium. Please read
Hargraves.substack.com
jackdevanney.substack.com
radiationeffects.com
whatisnuclear.com
Please turn your analytical bent to Sustainability by Nuclear.