Will it be a record year for Canadian wildfires? How are they changing over time?
An intense May means that it's going to be a big year for Canadian wildfires.
Note: I published a new post with updated wildfire burn data for 2023, extending it from 11th June to the end of June.
The news in the past week has been filled with pictures of orange skies over New York and Washington DC. Smoke and pollution from the Canadian wildfires pushed several of North America’s cities near the top of the world’s ‘most-polluted cities’ list.
There has been lots of debate about the cause of fires, whether they’re linked to climate change, and if this year is an anomaly in the historical record.
I wanted to understand how wildfires in Canada were tracking to previous years. Are they really larger this year, or are we forgetting other big events in the past?
To do this I looked at historical data from various national data sources: the Canadian National Fire Database; the National Forestry Database; and the Canadian Interagency Forest Fire Centre.
Here I’ll take a look at the data on how Canadian wildfires are changing over time; whether they’re getting worse; and I’ll briefly touch on their link to climate change.
The TLDR:
It’s likely that it will be a record year for Canadian wildfires (in terms of area burned). By ‘record’, I mean the largest in our wildfire records that go back to 1959.
Canada’s wildfires have spread early this year; it’s unusual for so much to burn by the end of May.
The number of wildfires is not increasing. In fact, the number has declined in recent decades.
The area burned by wildfires shows a small increasing trend. This can be hard to tease out from the data because there are always individual year ‘spikes’ that are much larger than others.
Canadian wildfires are caused by a mix of human activity (arson, cigarettes, campfires etc.) and lightning. But climate change can affect the local conditions and fuel available for these ignitions to spread.
Canada is on track for the largest wildfire year on record
Let’s look at how Canada’s wildfires for 2023 compare to previous years. The key point here is that we’re not even halfway through the year, and still have a large part of the ‘wildfire season’ to go.
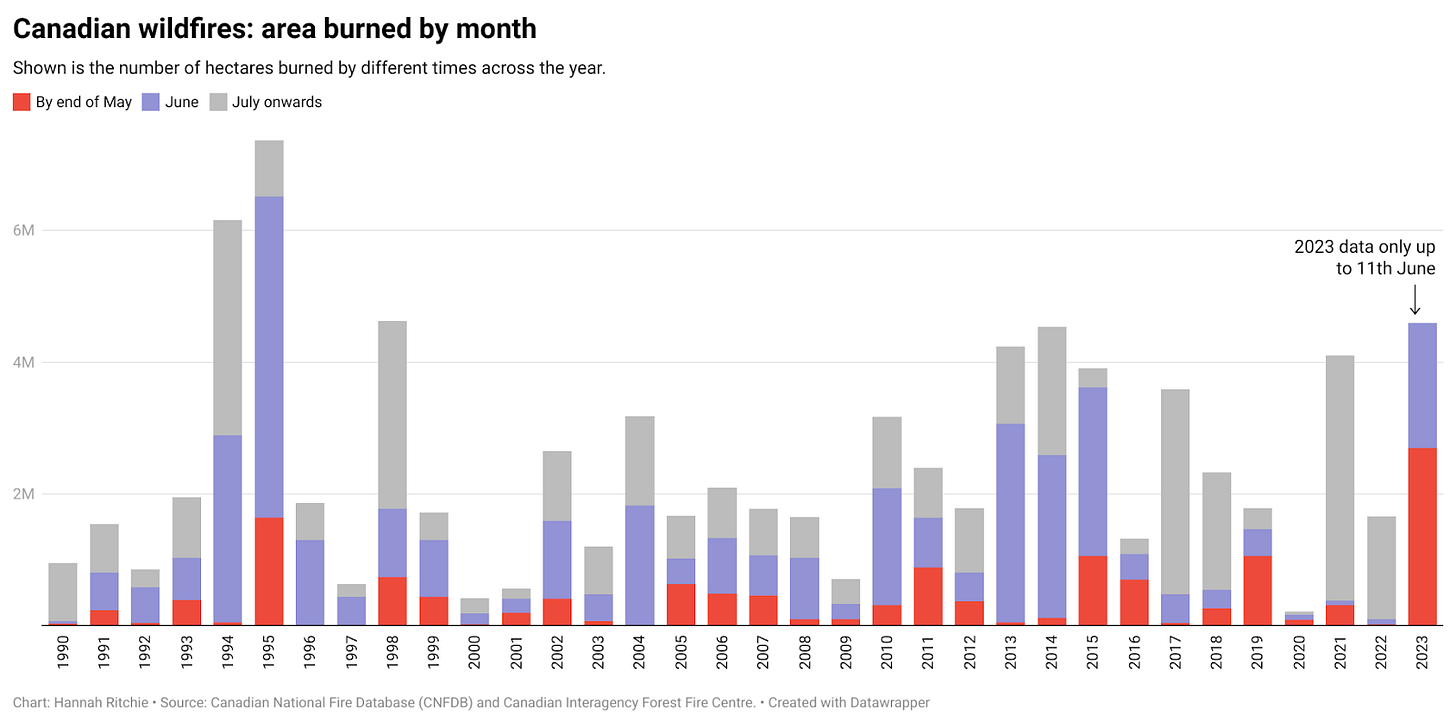
First, we’ll just focus on the area burned by the end of May. This year, 2.7 million hectares had been burned. That’s a lot. In the chart, we see the end-of-May totals by year, since 1990. As you can see, it’s the biggest by far. The only year that comes close is 1995, with 1.6 million hectares.
So what we can say is that the wildfire season has been severe and early this year. It’s not usually like this in May.
Let’s move on to June. In the chart below I’ve added the data for June for every year, on top of the end-of-May totals.
For 2023, we only have data until the 11th of June so far – we’re only a third of the way through.
As you can see, June can be a severe wildfire month. Especially in ‘peak’ or high-burn years. In 1995, 3.9 million hectares were burned in June alone. There was a period between 2013 and 2015 when 2.5 to 3 million hectares burned.
How does 2023 compare? Well, by the 11th of June, 1.9 million hectares has burned. If we were to assume that this rate continued throughout the month (which is a big assumption: here we’re just doing back-of-the-envelope), the June total would be around 5.2 million hectares.
Add that 5 million to the 2.7 million from May and we get close to 8 million hectares. That would be the largest since 1990, by far.
Finally, we need to understand what might happen after June. We can’t say what will play out, but we can look at historical data to see if wildfires are usually rampant from July onwards.
In the chart, I’ve stacked the total from July onwards to every year. That means every year – except 2023 – shows the annual total.
The pattern of fires varies quite a bit. In most years, the second half is quieter than the first. But there are exceptions: in 1998, 2017, 2021, and 2022, most of the burn came in the last 6 months.
What might be good news for this year is that wildfire burn tends to be less in the second half of the year when May and June have been severe. Take a look at 1995, 2013, ‘14 and ‘15. This would make sense: a lot of the prime ‘fuel’ i.e. vegetation had already been burned by July.
We’ll need to wait and see if this holds true this year.
Even with a quiet second half of the year, we can see that 2023 will be big. It’s already matching the annual totals of ‘peak’ years in the last few decades. And unless the fires slow dramatically in the next few weeks, its June total alone will have it competing with the annual totals from peak years in the 1990s.
All-in-all, 2023 is going to be a big wildfire year. Just how big will depend on how these fires spread in the next month.
The number of wildfires in Canada is not increasing
Let’s zoom out a bit to look at the broader patterns in how Canadian wildfires are changing.
To do this, we’ll look at data from 1959 onwards, published by the Canadian National Fire Database.1
A note of caution: when we look at longer-term data we should be aware of how the data quality changes over time. Newer data tends to be better – we monitor and record fires more rigorously, and have better instruments (e.g. satellites) to measure their spread.
In this dataset, many smaller and remote fires are missing from these records in the 1960s and 70s. For this reason, I have not included ‘60s and ‘70s data when looking at the change in the total number of fires over time. However, data on large fires is mostly complete for all years, so I have included all decades in that analysis.2
In the chart, we see the number of wildfires per year. In most years there are between 5,000 and 10,000.
The general pattern we see is a small rise in the number of fires from the 1980s to the 1990s, followed by a decline since then.
The number of Canadian wildfires is falling.
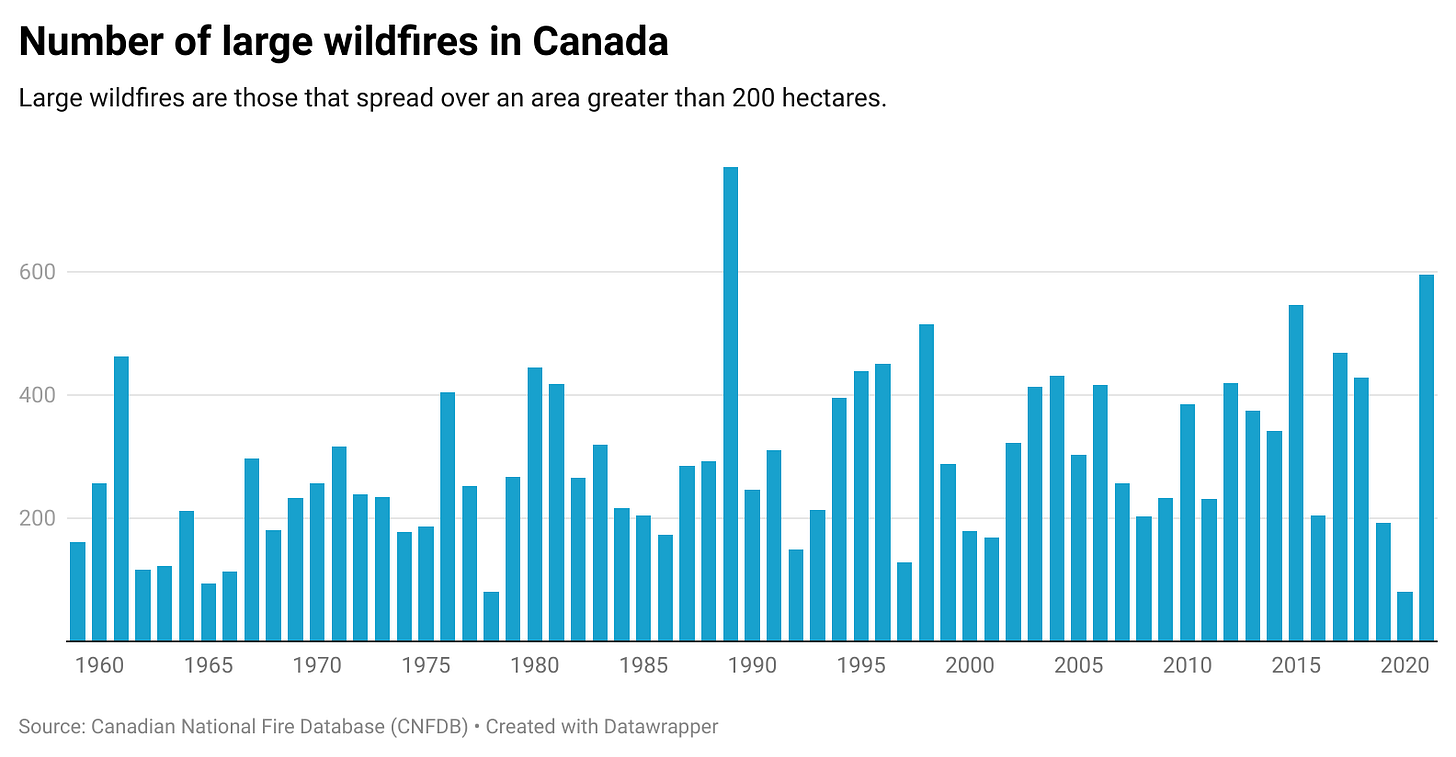
This is not the case when we look at the number of large wildfires – those greater than 200 hectares. In the chart, I’ve shown the number of large fires from 1959 onwards.
While there is a lot of year-to-year variability, the average trend is trending upward slightly.
There is a small upwards trend in the area burned by wildfires
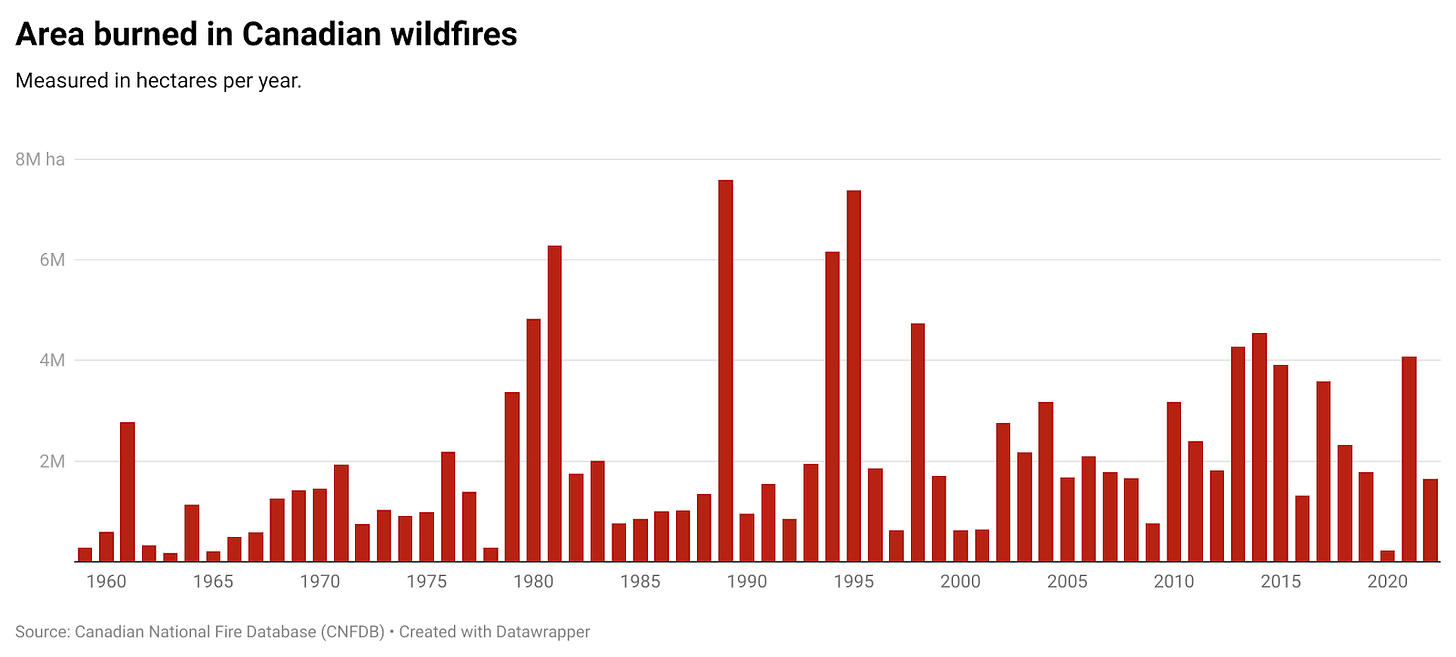
What about the extent of fires? We can measure this using the area burned per year.
We see this data since 1959 in the chart. Data from the 1960s and 70s should be reasonably complete here (despite small fires being missing) because large fires cause almost all of the area burned (more on this later).3
There is a lot of variability from year to year. Long periods of low wildfire activity are followed by large spikes that are three to four times bigger.
This is a common pattern with wildfires: years of low burn means that vegetation builds up, and can be burned in one go during an intense year. That’s why fire management strategies include controlled burning periods so that this dry material doesn’t accumulate.
While there are individual ‘spikes’ in the data, there appears to be a small upwards creep in the average area burned in recent decades.
Most damage comes from a small number of large fires
Most wildfires are not particularly notable. They don’t spread far, and are put out or die out quickly.
It’s a small number of large fires that do most of the damage. Around 5% of the fires cause more than 98% of the area burned.
This is not a new pattern. We can see it clearly from the data, dating back to 1959. Take a look at the scatterplot below.
On the x-axis I’ve plotted the share of fires that are defined as ‘large’, which means they extend over more than 200 hectares. On the y-axis we have the share of the total area burned that large fires are responsible for. Each dot is one year of data from 1959 to 2021.
They all cluster in the top-left corner. This means that large figures are a small percentage of all fires, but they cause nearly all of the area burned.
Lightning and arson start most wildfires, but climate change can make them more severe
I spent a lot of time looking at online debates about the latest Canadian wildfires. Every climate discussion had the same comments: “Arson!”; “Arson is bad”; “That’s a lot of arsonists”.
Their claim, of course, is that it’s arsonists that are to blame for wildfires, not climate change. But that’s a misunderstanding of what the link between climate change and wildfires is.
It’s not that climate change provides the initial spark for a fire. It’s that it creates weather conditions that make an initial spark spread into a full-blown wildfire – and a bigger one than in a world without climate change (more on this later).
Look at the causes of wildfires in Canada – shown in the chart below – and we see that most fires are started by humans through arson, or unintentional spread from campfires, cigarettes etc. But the other big contributor in Canada is lightning; strikes start around half of its wildfires. That’s quite different from other regions, where a small percentage of fires are started by ‘natural’ factors such as lightning.
On the chart, there’s no category called ‘climate change’. But that doesn’t mean that climate change isn’t a factor. There are a number of factors that determine whether a lightning strike, or a rogue campfire results in a large wildfire. It can affect several of them.
Climate change increases the risk of larger wildfires in some regions
Many people were quick to blame the ongoing wildfires in Canada on climate change. But when it comes to the attribution of individual weather events, I like to wait for the analysis from the experts.
There are amazing scientists that focus on this attribution work. The meteorologist, Dr Frederike Otto co-leads World Weather Attribution (WWA), a project that does in-depth analysis of specific weather events to estimate their likelihood in a world with and without climate change. Their results go in both directions: they expect that climate change did not contribute to the recent floods in Italy, but that it has increased the severity of the ongoing drought in the Horn of Africa.
But we can already say something about the broader link between wildfires and climate change. We can understand whether climate change can make events more likely, even if we can’t do this easily for individual events.
The short of it – and this should be intuitive – is that drier vegetation burns more easily.4 Try to burn a log full of water, then try a dry one. It’s much easier. To set a piece of wood or vegetation alight, it has to reach its ‘combustion temperature’. When a branch is wet, some of the energy will go into raising the temperature of the wood, but a lot will be absorbed by the water. Less water means more energy to raise the wood’s temperature.
That means that drier conditions, especially when combined with hotter weather, will increase the risk of wildfires. And that’s exactly what we expect for many regions as a result of climate change. Many academic studies support this increased risk (although not for every region). For a good debrief on this climate link, see this post from Zeke Hausfather and this article by Daisy Dunne in Carbon Brief.
Climate change is not the only factor. How we manage land matters a lot too. In the past, societies would often manage fire risk through deliberate, controlled burning. We do this less, which can lead to the build-up of prime fuel material in a ‘big’ year.
All-in-all, it looks like Canada is on-course for a very big wildfire year. Possibly the largest on record.
I didn’t include pre-1990 data in the monthly breakdowns that we just looked at, because I couldn’t find them for earlier years.
Pre-1980s is not available for Nova Scotia and New Brunswick. However, a tiny fraction of Canada's fires and area burned comes from these provinces, so I don't expect this to affect the conclusions or trends.
A number of academic papers – based on this wildfire data – report similar results to the ones I present here (that there is an increase in area burned since 1959).
These analyses are recommended by the Canadian National Fire Database (https://cwfis.cfs.nrcan.gc.ca/ha/nfdb) which suggests that they think the entire time-series from 1959 is of sufficient and comparable quality to draw such conclusions.
Here are a few of these studies:
Hanes, C. C., Wang, X., Jain, P., Parisien, M. A., Little, J. M., & Flannigan, M. D. (2019). Fire-regime changes in Canada over the last half-century. Canadian Journal of Forest Research, 49(3), 256-269.
Stocks, B. J., Mason, J. A., Todd, J. B., Bosch, E. M., Wotton, B. M., Amiro, B. D., ... & Skinner, W. R. (2002). Large forest fires in Canada, 1959–1997. Journal of Geophysical Research: Atmospheres, 107(D1), FFR-5.
Abatzoglou, J. T., & Williams, A. P. (2016). Impact of anthropogenic climate change on wildfire across western US forests. Proceedings of the National Academy of Sciences, 113(42), 11770-11775.


This article felt like it tried to stay neutral and look at both sides. That is appreciated! Ultimately, how we understand climate change, as it’s such a complex and difficult thing model accurately, remains key. It’s harder to see a way forward once any topic/issue becomes politicized. Thank you for your thoughtful forest fire analysis!
In the US the Forest Service has excised from the historical record fires (IIRC) prior to the 1970s. The trend since then is to lower acreage burned annually with some spikes in recent years, but not dramatically. However, if you rummage around, the fire acreages burned annually in the US are available back to the WW1 era when the average annual acreage burned through the 1920s and early 1930s was 10x the acreage burned annually in the past 50 yrs, which is one reason why the fire fighting divisions of the Forest Service were developed in the first place. It is not clear why the Forest Service elected to remove that information from their web site, although accurate surmises are easily made as to the reasons.