
Why “my country only emits 1% of emissions” is no excuse for rich countries to not tackle climate change
Five reasons why small countries can, and should, punch above their weight.

If the UK’s CO2 emissions fell to zero tomorrow, the climate would barely notice. It emits less than 1% of the global total.
This is an argument I hear a lot: “My country’s emissions are so negligible, it doesn’t matter what we do. It won’t make a difference”.
It’s true: the emissions of many countries in the world are completely dwarfed by a few big players. We see this in the chart below.
But there are several reasons why rich countries with ‘negligible’ emissions need to step up to the challenge. What they do does matter.
Let me explain why their excuses don’t cut it.

1. Rich countries – that have emitted the most – have a moral responsibility
The first argument is short and sweet. It’s a moral one.
Rich countries have often emitted more historically. The UK emits just 0.9% of emissions today1 But if we add up all of its historical emissions, it accounts for 4.5% of the world’s cumulative CO2 emissions. Germany makes up more than 5% of the total.
Rich countries should get their emissions to zero quickly to not only reduce climate change impacts for poorer countries, but to ‘make space’ in the global carbon budget for them to develop.
2. If every country that had ‘negligible emissions’ decided to do nothing, we wouldn’t be able to fix climate change
Only six countries in the world have emissions that account for at least 2% of the global total: China, the United States, India, Russia, Japan, and Iran.
Every other country in the world emits less than 2% and might consider themselves to be “negligible”.
But, collectively, all of these countries add up to 36% of the world’s CO2 emissions. That’s more than China. We see this global breakdown of emissions in the visualisation below.
Imagine if all of these countries decided to do nothing. The biggest chunk of the world’s emissions wouldn’t be tackled. It’s simple: the world won’t tackle climate change if countries with ‘negligible’ emissions do nothing. Nor will it do this if big players like China, the United States, and India do nothing either.

One thing that I want to make clear is that this argument is primarily targeted at the world’s richest countries. Most of them fall within the ‘Rest of the World’ box. This includes the UK, Germany, France, Spain, Sweden, Norway, Canada, and Australia, among others.
It is not targeted at low-income countries that have contributed very little to the problem, have tiny carbon footprints, and need to prioritise development. These countries will, and should, increase their emissions (even if temporarily), and richer countries need to ‘make space’ for them in the carbon budget by reducing theirs rapidly.
In the chart below I’ve separated out the very smallest emitters: collectively, these 142 countries (or territories, such as island states) emit just 5% of the total. Again, to be clear: the “Rest of the World” box is dominated by rich countries that often make the ‘negligible emitter’ excuse: that’s who I’m focusing on here.

3. Many of the ‘negligible’ emitters offshore some of their emissions
The numbers above are based on ‘production-based’ emissions – how much each country emits domestically. But countries import goods and services, and the emissions of this ‘stuff’ are not included in their emissions. If the UK buys goods from China, it’s China that adds those emissions to its accounts.
We can calculate ‘consumption-based’ emissions, which adjusts for the potential offshoring of emissions to other countries.
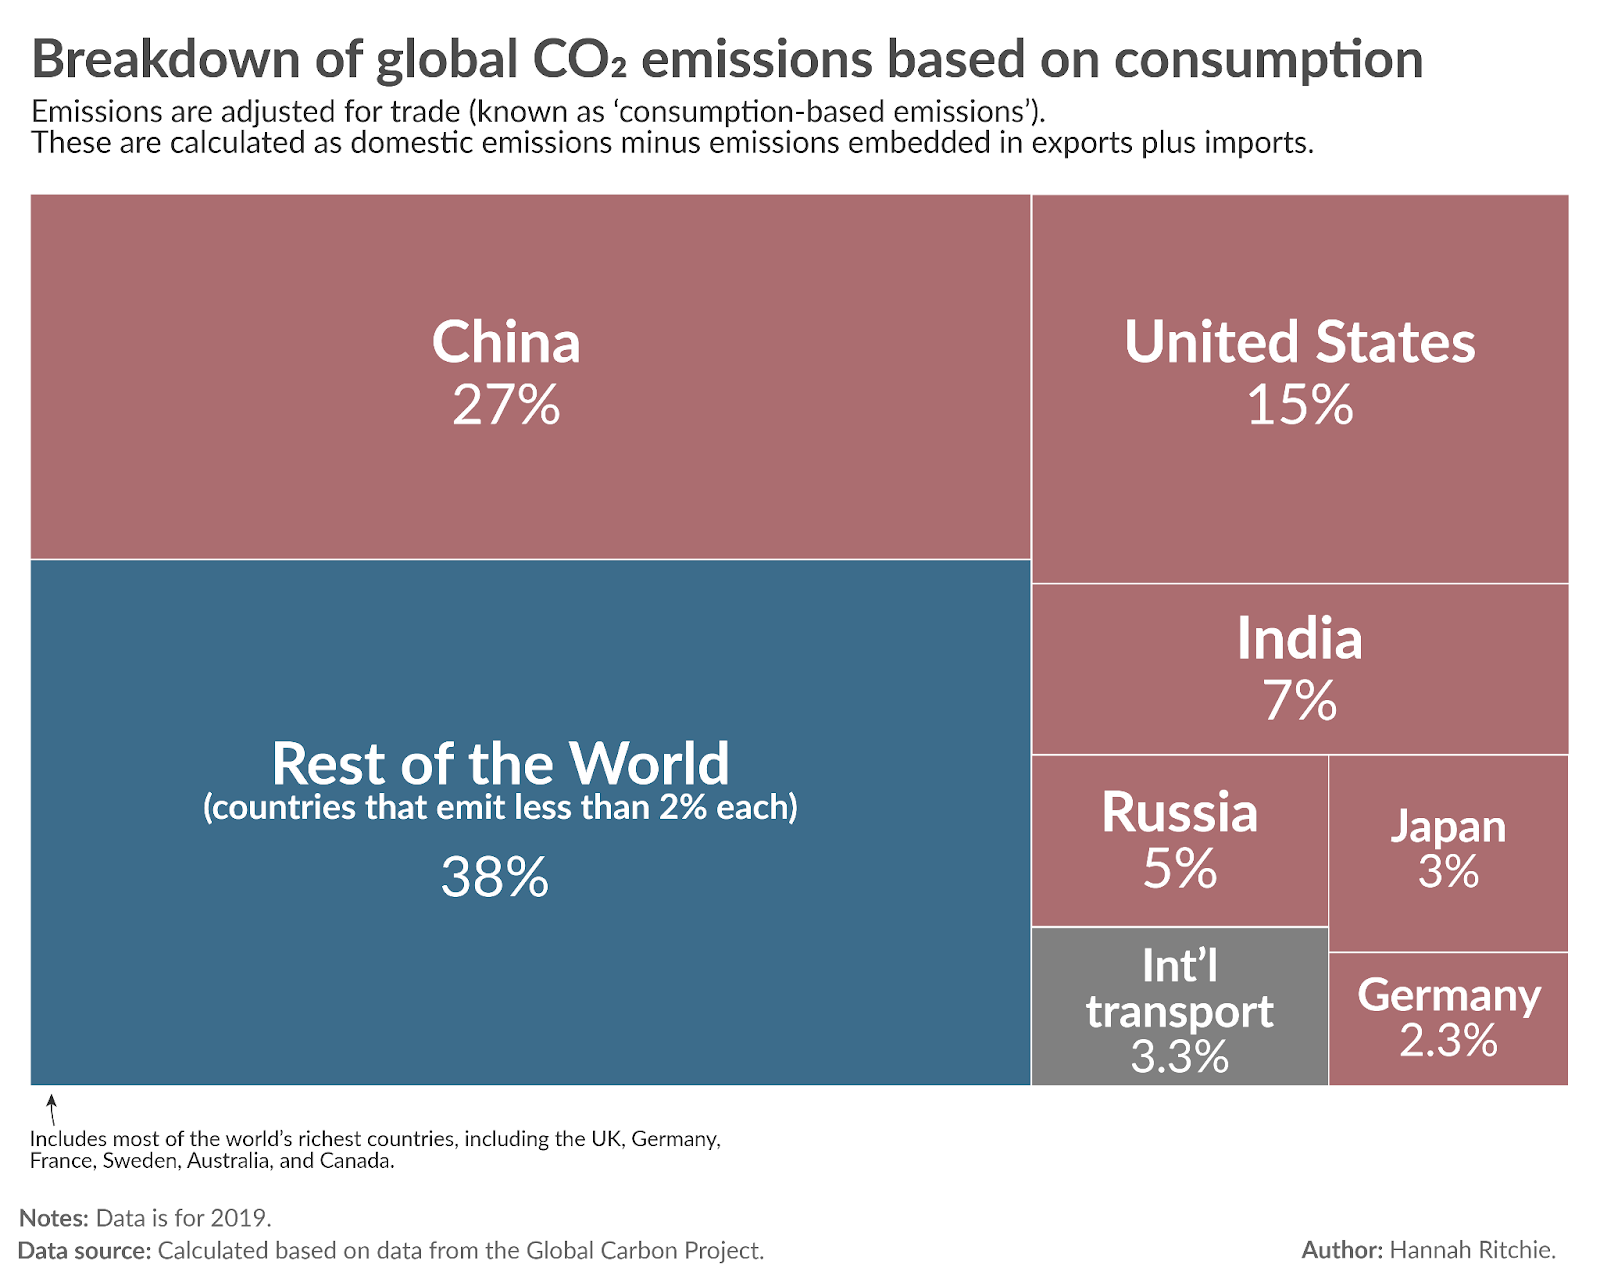
In the chart below we see the global breakdown of consumption-based emissions. Note that we don’t have consumption-based figures for 2021, yet so I’m using data for 2019 instead. That’s why the share for international transport is slightly different than in the charts above.
It is true that many of the world’s richest countries have offshored some of their emissions. See my article on this on Our World in Data where you can explore the data by country.
But the high-level picture of global emissions doesn’t change that much. China’s emissions go down, and the USA’s’ goes up. But only Germany breaks through the “2% of emissions” line.
That means that even when we adjust for offshoring, most rich countries can still make the “we’re negligible emitters” claim.
4. Innovating and deploying low-carbon technologies make them cheap for the rest of the world
The “we’re too small to make a difference” argument rests on the assumption that domestic emissions are all that matters. That the UK’s impact on climate change is only the CO2 it emits at home.
This isn’t true. It operates in a world of connected markets, technologies and political influence.
To decarbonise, we need low-carbon technologies to be cheap. That’s how we make sure that every country can reduce its emissions without it coming at the cost of development. If we want poorer countries to follow a cleaner development pathway, low-carbon technology needs to be cheap. Cheaper than fossil fuels.
How does that happen? Through innovation and the learning that comes from scaling these technologies.
The price of solar, wind and batteries have plummeted in recent decades. The price of solar has fallen by 99.8% since the 1970s. It has fallen by 90% in the last decade alone. The price of lithium-ion batteries has fallen by 98% since 1990.
This didn’t happen by accident. Their prices fell as the world deployed more. This is called a ‘learning curve’. The learning curve for solar is shown in the chart below. Every time the world’s cumulative solar capacity doubled, the price of solar panels dropped by 20%, on average.

When countries invest early – especially when these technologies are expensive – they bring prices down for the rest of the world. They are helping to shape the emissions trajectory of every other country in the world.
Rich countries should be taking the lead. They have built their wealth by burning fossil fuels, and have the money to invest in new technologies.
This is the biggest contribution that countries can make. Their impact is much bigger than their 1% slice of the emissions pie.
5. Any country – regardless of its size – can smash ‘glass ceilings’ and set a model for others
I bet many politicians curse when they see countries around them doing well. It makes their country look bad. If the UK is slashing its CO2 emissions its European neighbours have little excuse. They can’t argue that it can’t be done.
This is about glass ceilings.
Running a sub four-minute mile seemed impossible. So many had tried and failed. Some medics said it wasn’t physiologically feasible. Until 1954 when Roger Bannister did it. Just 46 days after his record-breaking feat, another runner beat the four-minute clock. A year later, three men achieved it in the same race. More than a thousand runners have now gone under four minutes.
Roger Bannister smashed the limits of what people thought was possible.
This is where small countries can set the stage. No country has managed to get off fossil fuels. Or got petrol and diesel cars off its roads. Or cut its greenhouse gas emissions to zero. That means everyone still has the excuse that it can’t be done. Until a country achieves it. Then the excuses run dry.
Small countries can punch above their weight by resetting expectations of what is possible. They can set a model for how to transition to renewables quickly; how to build a low-carbon transport system; how to end deforestation.
Norway emits just 0.1% of the world’s emissions. Still, just 0.13% when we adjust for offshoring. But it has smashed glass ceilings on the rollout of electric cars. More than 80% of new cars sold in Norway are electric (see the chart below).2 It is building a model that other countries can follow. It’s showing them what is achievable and robbing them of the excuse that it can’t be done.
Climate leaders, regardless of their size, can set expectations for the rest of the world.

We won’t solve climate change without small players stepping up to the plate
If the world’s biggest emitters do nothing, we don’t stand a chance of tackling climate change. But we will also fail if small emitters do nothing.
The argument from rich countries that “my country’s emissions are negligible” is a cop-out. It’s also inherently nationalistic and self-serving. Climate change is a global problem that needs international collaboration. It’s about building a better world, together.
All of the underlying data used in these calculations comes from the Global Carbon Project.
Emissions include all ‘fossil’ emissions, which is those from burning fossil fuels, flaring, and industrial processes such as cement production. Land use change isn’t included.
Full reference:
Friedlingstein, P., O'Sullivan, M., Jones, M. W., Andrew, R. M., Gregor, L., Hauck, J., Le Quéré, C., Luijkx, I. T., Olsen, A., Peters, G. P., Peters, W., Pongratz, J., Schwingshackl, C., Sitch, S., Canadell, J. G., Ciais, P., Jackson, R. B., Alin, S. R., Alkama, R., Arneth, A., Arora, V. K., Bates, N. R., Becker, M., Bellouin, N., Bittig, H. C., Bopp, L., Chevallier, F., Chini, L. P., Cronin, M., Evans, W., Falk, S., Feely, R. A., Gasser, T., Gehlen, M., Gkritzalis, T., Gloege, L., Grassi, G., Gruber, N., Gürses, Ö., Harris, I., Hefner, M., Houghton, R. A., Hurtt, G. C., Iida, Y., Ilyina, T., Jain, A. K., Jersild, A., Kadono, K., Kato, E., Kennedy, D., Klein Goldewijk, K., Knauer, J., Korsbakken, J. I., Landschützer, P., Lefèvre, N., Lindsay, K., Liu, J., Liu, Z., Marland, G., Mayot, N., McGrath, M. J., Metzl, N., Monacci, N. M., Munro, D. R., Nakaoka, S.-I., Niwa, Y., O'Brien, K., Ono, T., Palmer, P. I., Pan, N., Pierrot, D., Pocock, K., Poulter, B., Resplandy, L., Robertson, E., Rödenbeck, C., Rodriguez, C., Rosan, T. M., Schwinger, J., Séférian, R., Shutler, J. D., Skjelvan, I., Steinhoff, T., Sun, Q., Sutton, A. J., Sweeney, C., Takao, S., Tanhua, T., Tans, P. P., Tian, X., Tian, H., Tilbrook, B., Tsujino, H., Tubiello, F., van der Werf, G. R., Walker, A. P., Wanninkhof, R., Whitehead, C., Willstrand Wranne, A., Wright, R., Yuan, W., Yue, C., Yue, X., Zaehle, S., Zeng, J., and Zheng, B.: Global Carbon Budget 2022, Earth Syst. Sci. Data, 14, 4811-4900, https://doi.org/10.5194/essd-14-4811-2022, 2022.
This data comes from the International Energy Agency (IEA). You can explore EV sales by country here: https://www.iea.org/data-and-statistics/data-tools/global-ev-data-explorer
Hannah,
I really enjoy your work, keep it up!
If you are looking for suggestions on things to write about, I would like to understand these 2 graphs and how China has overtaken the UK in energy usage and electricity production per capita:
https://ourworldindata.org/grapher/per-capita-energy-use?tab=chart&country=GBR~CHN
https://ourworldindata.org/grapher/per-capita-electricity-generation?tab=chart&country=CHN~GBR
Very interesting data treatment.
Can you explain how when you proceed from "National Emissions" to "Consumption based emissions", the percentage of "International Transport" increases from 2,8% to 3,3% ? I would have thought the sum was always the same in quantity and 100% for the whole world and the International Transport ? Is it same year: one is 2019 but the other might be 2020 ?