
Which countries are scaling solar and wind the fastest?
The leaderboard is quite different depending on what metric you look at.

Anyone who has been following clean energy news might think the answer to this question is obvious: China.
Its build rates are pretty stunning. There are many comparisons that capture this, but here’s just one: China is adding more solar capacity in a single year than the US has in its entire history.1
But, of course, China is the world’s second-most populous country, so we might expect it to add a lot. Just as people constantly compare countries’ “progress” or “responsibility” for carbon emissions in different ways — the annual total, per capita, historical emissions — it’s also useful to get perspective on clean energy rollout across different measures.
So here I wanted to get a quick perspective on how countries compare in their rollout of solar and wind power. Each of these “slices” of the data are useful in their own way, and can tell us something valuable. The point is not to pit them against each other to find the ultimate comparison metric.
To do these comparisons, I’ve relied on solar and wind power generation data from Ember Energy. I’m comparing the yearly generation in 2024, compared to 2021. You could compare year-to-year, but generation can fluctuate quite a bit, so measuring across three years says a bit more about the signal/trend than the noise. That does mean that countries who have gone hard on solar and wind in just the last year — or have just hit the steep part of the curve in the last year — are at a slight disadvantage.
It also doesn’t fully include some of the solar and wind plants added last year, because most of their generation will only show the following year i.e. 2025.
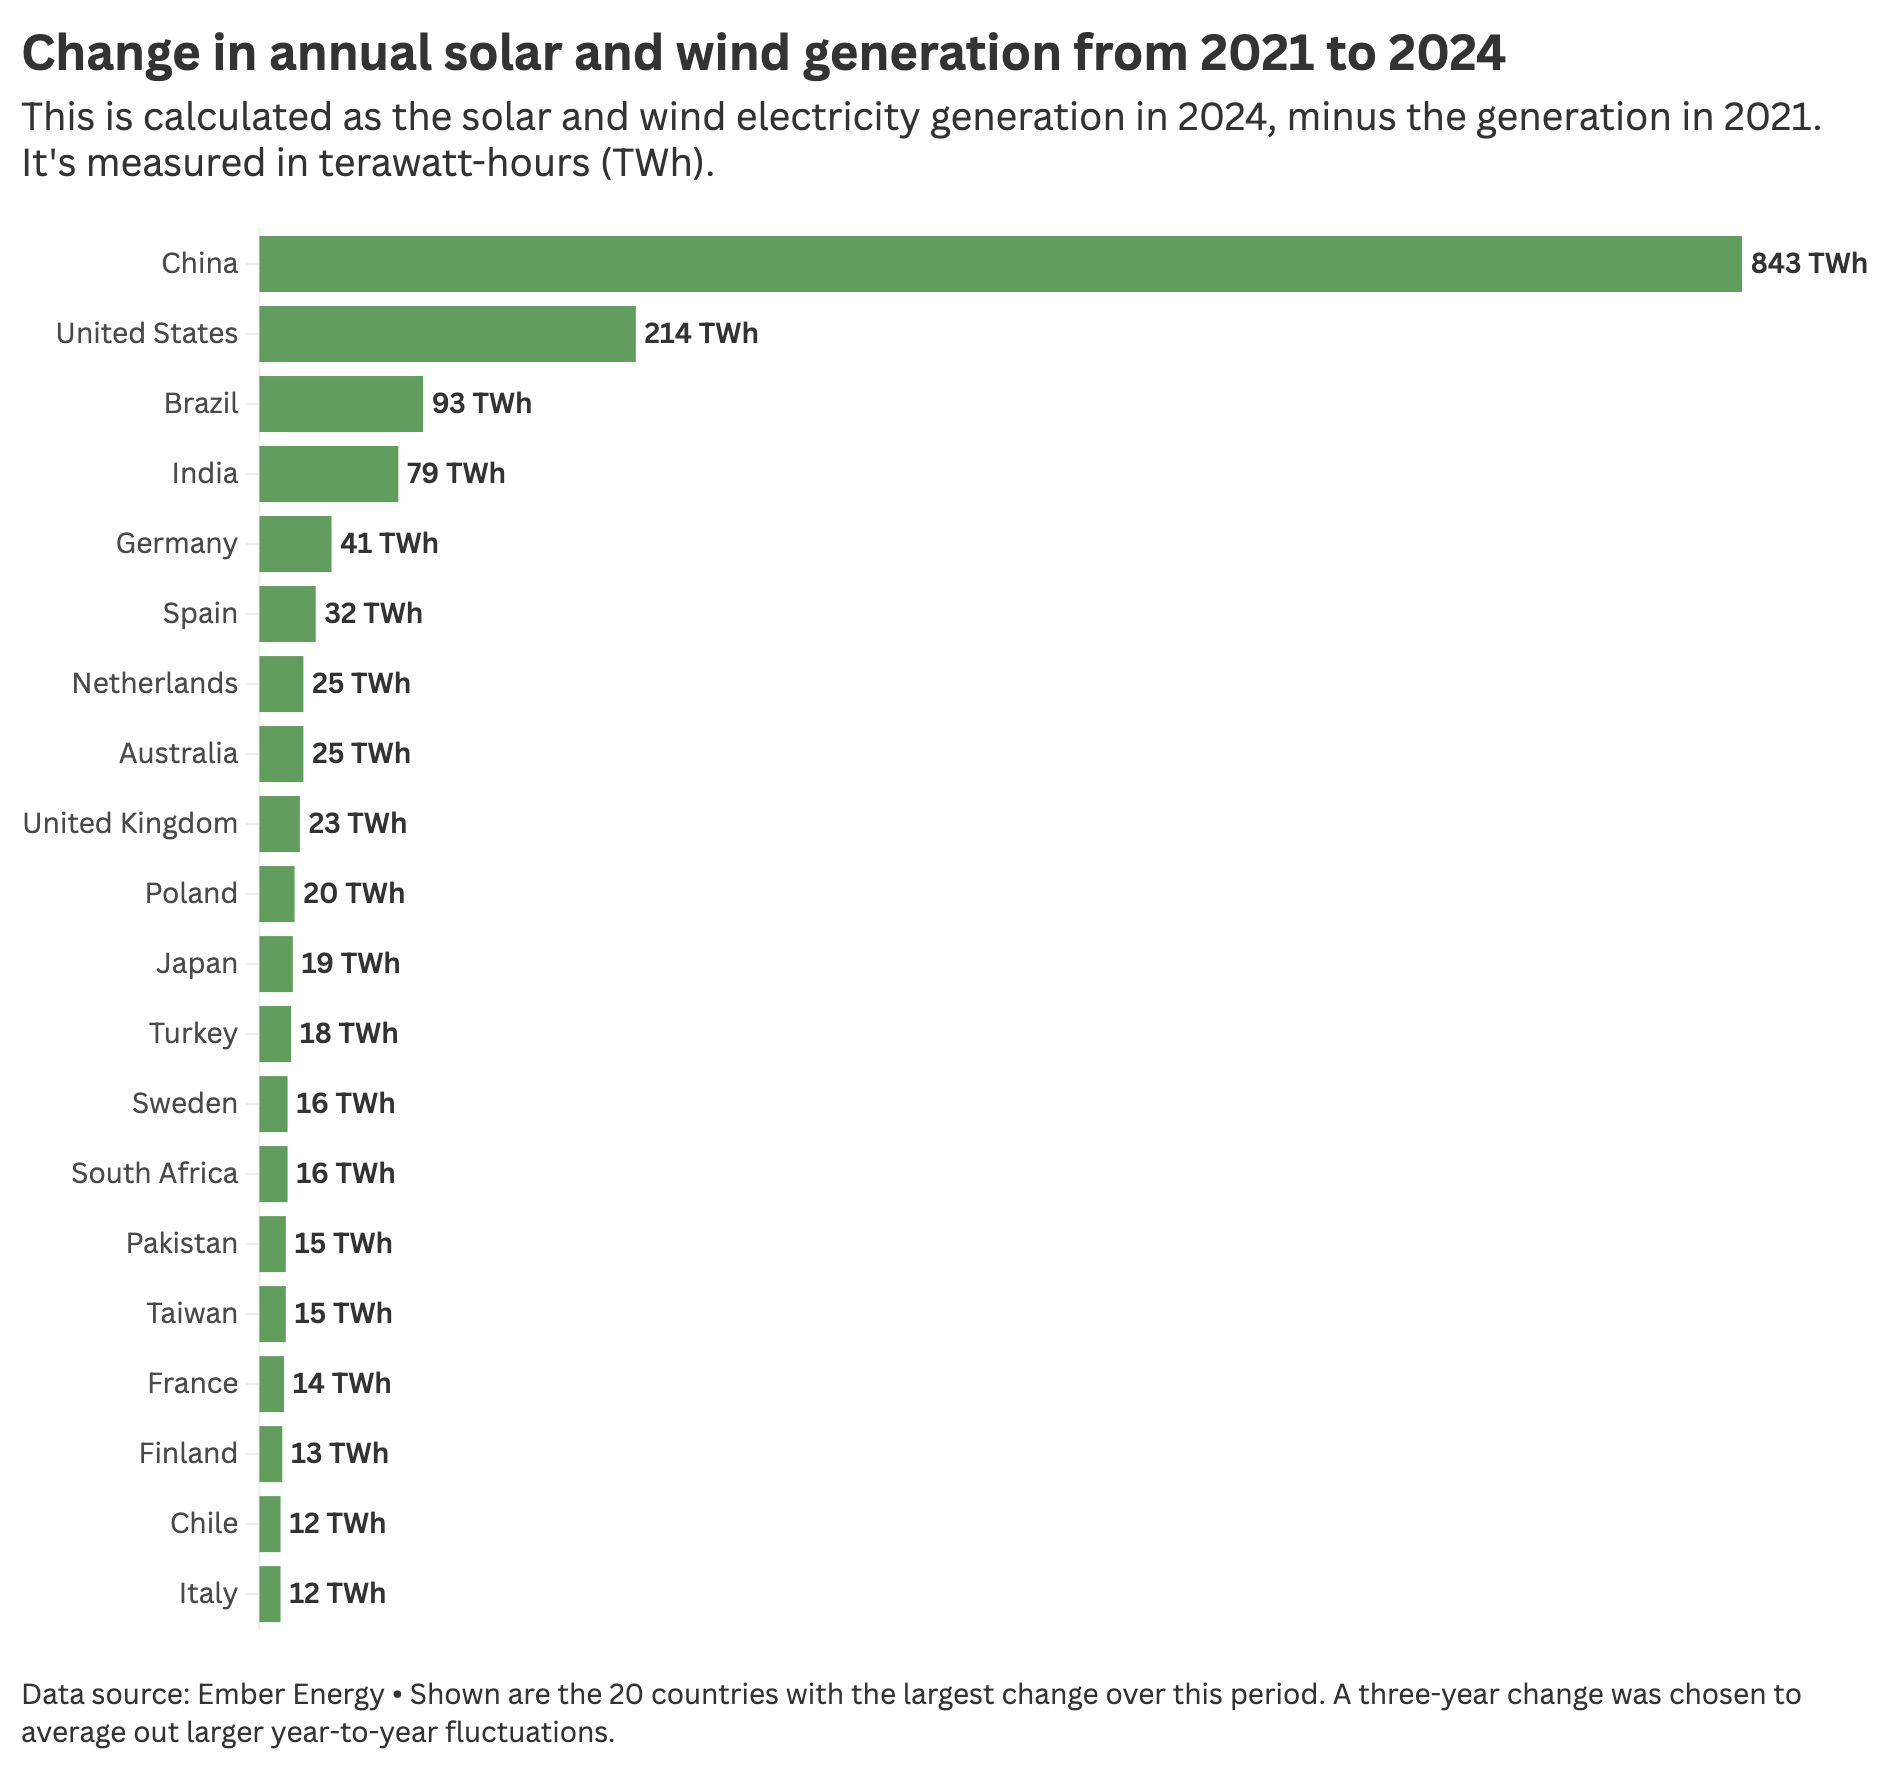
Annual solar and wind generation
The first metric is simply looking at total annual generation. You can see this in the chart below. It measures the change in generation across the previous three years.
The results are not surprising. China is well ahead of everyone else. In fact, its additional solar and wind generation alone is more than the other 19 countries in the “top 20” combined.
The United States is in second, followed by Brazil, India and Germany. Again, unsurprisingly, a lot of the most populous and/or richer countries appear on this list.
There are a few reasons why I think total generation figures are useful to look at. First, it gives some sense of perspective on how much solar and wind can be built and scaled at a given pace. Second, the total amount of these technologies that are built globally matters a lot for prices. Solar prices have fallen by roughly 20% every time global cumulative capacity has doubled.2 Total numbers give some perspective on the countries that are driving these doublings.
Per capita solar and wind generation
It would be unreasonable to expect that a country with 10 million people is going to be building and scaling technologies at the same rate as a country with over a billion people. It would be unfair to say that smaller countries are not “doing their share” because they never appear on a “total generation” leaderboard.
So let’s look at the change when we adjust for population. Again, this shows the change in solar and wind generation per capita between 2021 and 2024.
Europe dominates the top spots. Finland is far ahead, followed by Sweden, the Netherlands and Denmark.
Some Nordic countries (I’m aware that doesn’t include the Netherlands) tend to use a lot of electricity per person.3 To give some perspective: in the UK, we use around 4,000 kWh per year, compared to 15,000 in Finland, and 16,000 in Sweden. That means these countries need to produce a lot more solar and wind per person to put a dent in their total electricity use.
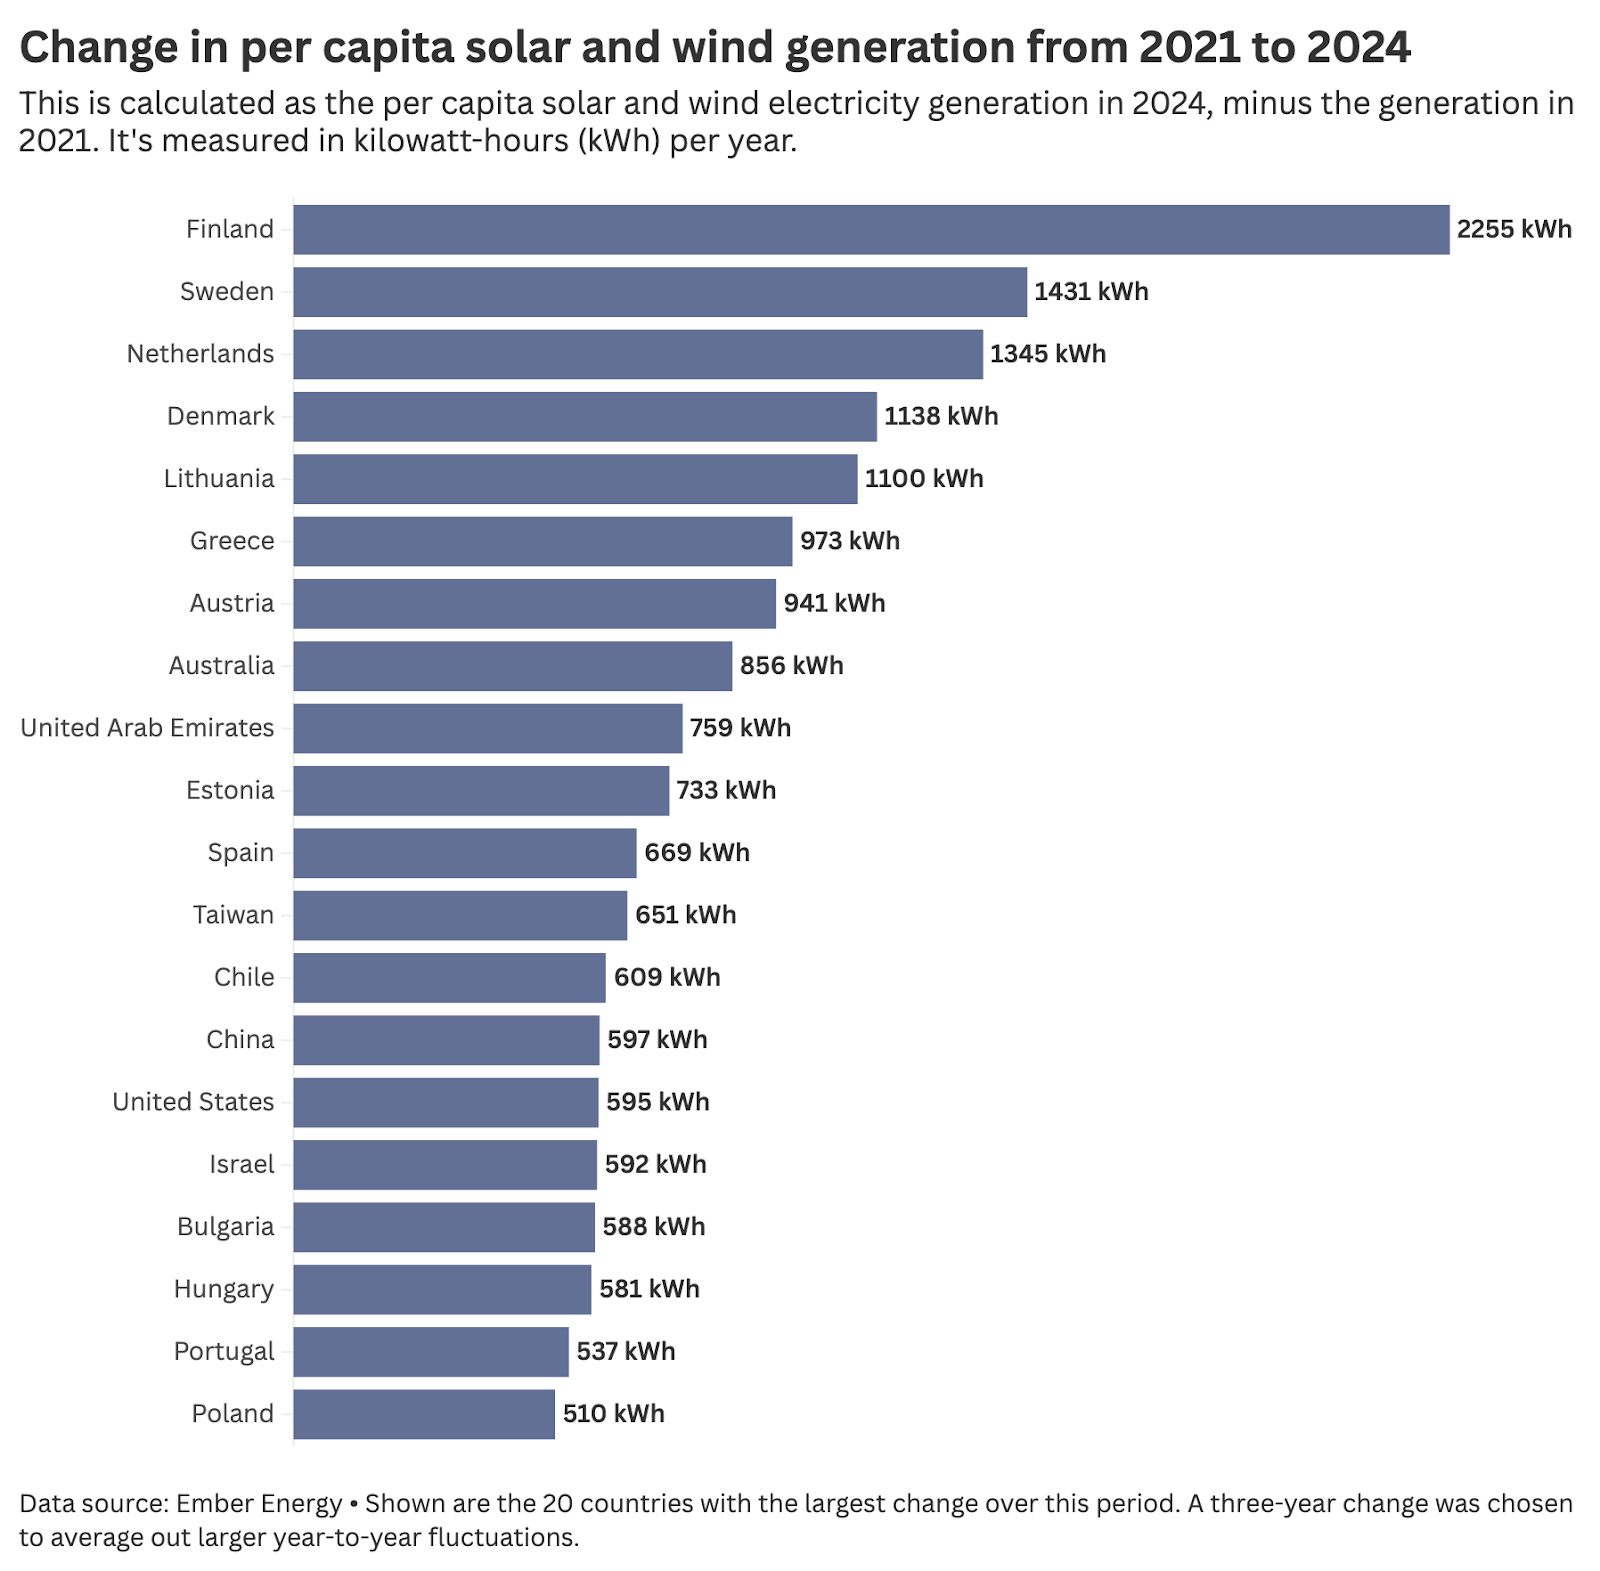
Lithuania is a country I didn’t have on my radar (but is interesting, as we’ll see in the next section). It has increased solar and wind generation a lot in recent years.
What’s perhaps most interesting is that both China and the United States have slipped far down the list. Their change in per capita generation over those three years was basically equal (although China added more wind than the US, and the US added more solar per person).
Solar and wind’s share of total electricity generation
A final adjustment we can make is to not only consider differences in population, but also the amount of electricity that’s being generated as a whole.
A country could be adding a lot of renewables per person, but it has an absolutely huge electricity footprint, then it could be hardly making a dent in fossil fuels at all. You can argue that countries should be scaling solar and wind in relation to the size of their electricity grids overall.
The metric below tries to capture this. It measures the change in solar and wind’s share of electricity generation in that given country. It shows the percentage points change over those three years.
Lithuania topping the list was definitely a surprise to me. But solar and wind’s share of electricity generation increased from 36% to almost 66% in just three years. One thing to bear in mind is that Lithuania still relies a lot on electricity imports - they make up around 40% of its total generation. Being curious about what has been going on with Lithuania’s electricity mix, I ended up down a bit of a rabbit hole. If you’re interested, I’ll leave some details in the footnote.4
The Netherlands, Estonia (another surprise to me), Denmark and Germany completed the top five.
The complete top 20 on this metric is extremely Europe-heavy. The only exceptions were Chile and Brazil.
Neither China nor the United States made this list. In China, solar and wind’s share of generation increased by 7 percentage points, and in the US, by just 4 percentage points. In China’s case, this is probably because electricity generation overall is growing so rapidly (hence you need to add a lot of solar and wind to increase its share). In the US, it’s because total electricity demand is already high.
This focuses on domestic contributions to clean energy development
Finally, it’s worth noting that all of these metrics focus on the domestic rollout of solar and wind. That’s obviously crucial. But countries also play different rolls on the global stage.
Some high-income countries are more generous in financing clean energy programs in lower-income countries than others. Some provided financial support for solar and wind earlier in their development journeys, when they were still expensive and that has given us cheap solar panels today.
And I would be remiss to leave out the fact that China completely dominates the mineral refining and solar and battery manufacturing industries, providing increasingly cheap technologies for the rest of the world.
I still find China’s total buildout of solar and wind to be incredibly exciting. As the world’s largest emitter, it’s arguably one of the most important trends of the century. But looking at different slices of this data also highlights that many other countries — ones that rarely get mentioned — are also making impressive progress given their own constraints and resources.
📚 My new book comes out in the UK next week. If you like this post, you’ll probably enjoy it. Pre-orders are available wherever you can get books:
Between 2023 and 2024, China added 227 GW of solar power. The USA's cumulative installed capacity in 2024 was 177 GW.
I'm aware we're not talking about capacity here so "built" is maybe not the perfect word. But generation is pretty strongly correlated with capacity.
This is for various reasons, including the fact that they have high heating demands, and a lot of that heating is electrified (compared to us using mostly gas boilers in the UK).
Large industrial output also plays a role, especially since this electricity use is then spread across fairly small populations, making per capita figures pretty high.
Most of Lithuania’s electricity used to come from nuclear power. It had two nuclear reactor units. One closed in 2004, and the other in 2009. These were Soviet-style reactors, similar in design to the one at Chernobyl. Shutting these plants was a requirement for them to get into the European Union (EU); when they applied to join the EU in the late 1990s, part of the agreement was that they had to close. The EU provided some financial support to help them do that.
The impact was that they suddenly had to rely on large electricity imports. In 2009, they were a net electricity exporter, and by 2010 they were a big importer.
The renewables share of generation will accelerate as storage and grid expansion continues. The capacity we already have globally is underused until that happens.
This data needs to be compared with the analysis Hannah did here:
https://www.sustainabilitybynumbers.com/p/solar-wind-nuclear-rates
Looking at the Netherlands (1345KWh per person added over three years, and Sweden (1431), they are adding about 450KWh per year.
That matches the French nuclear boom (450KWh per per person per year) between 1979 and 1989. All be it, the French "boom" went on for the better part of two decades. The "solar boom" has only been going since about 2021.