
How unprecedented is power demand growth in the United States?
Electricity generation is expected to rise. But will it grow much faster than it did in the past?

I often hear about “skyrocketing” demand for electricity in countries like the United States (here’s just one example).
There is no doubt that electricity demand will rise (or, in many countries, already has started rising). This is often a good thing as it represents a shift from fuels to electricity, which is another huge part of the energy transition.
There is a lot of hand-wringing about whether countries will be capable of meeting this extra demand. But that made me curious about how unprecedented this growth really is. How do current and future growth rates compare to the past? Is it really the case that electricity demand will “skyrocket”, or are we really just talking about a fairly quick increase?
Let’s run through some numbers for the US to get some perspective.
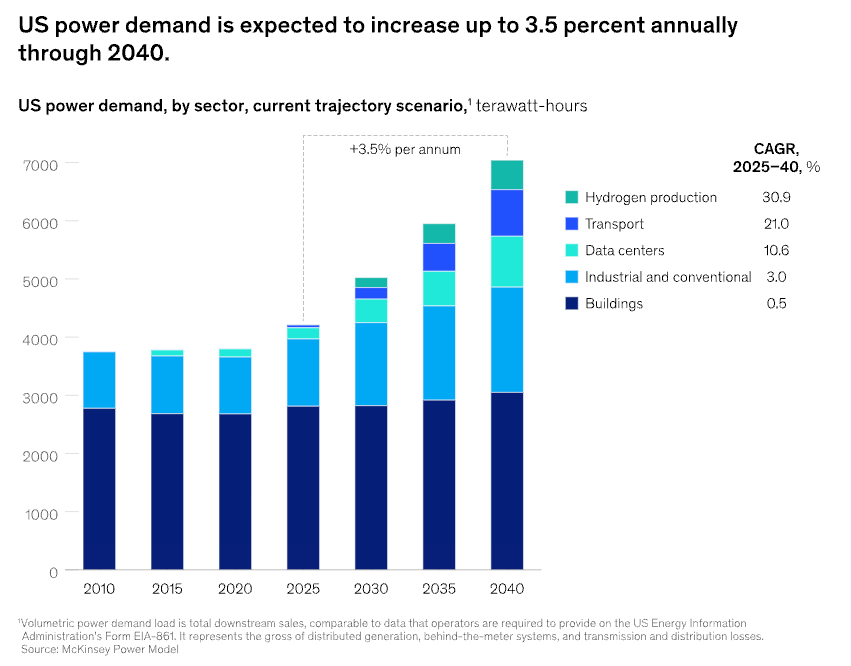
The chart below is a very typical projection that you’ll see in many reports from think tanks, analysts, and energy agencies. This one is from McKinsey, and was published this year (so it’s recent). There is, of course, the question of whether McKinsey’s projections are correct; colour me sceptical about the rise of hydrogen, and who knows what data centre demand will be in 2040. Other analysts produce different projections, some less aggressive and others more so than McKinsey. But let’s assume that this one is not far off.
As you can see, US electricity demand remained flat throughout the 2010s but is now rising, and this is expected to continue through 2040. They estimate that demand increases by around 3.5% each year during that period.
Compared to the 2010s, any growth in demand is a change. But what about in previous decades?
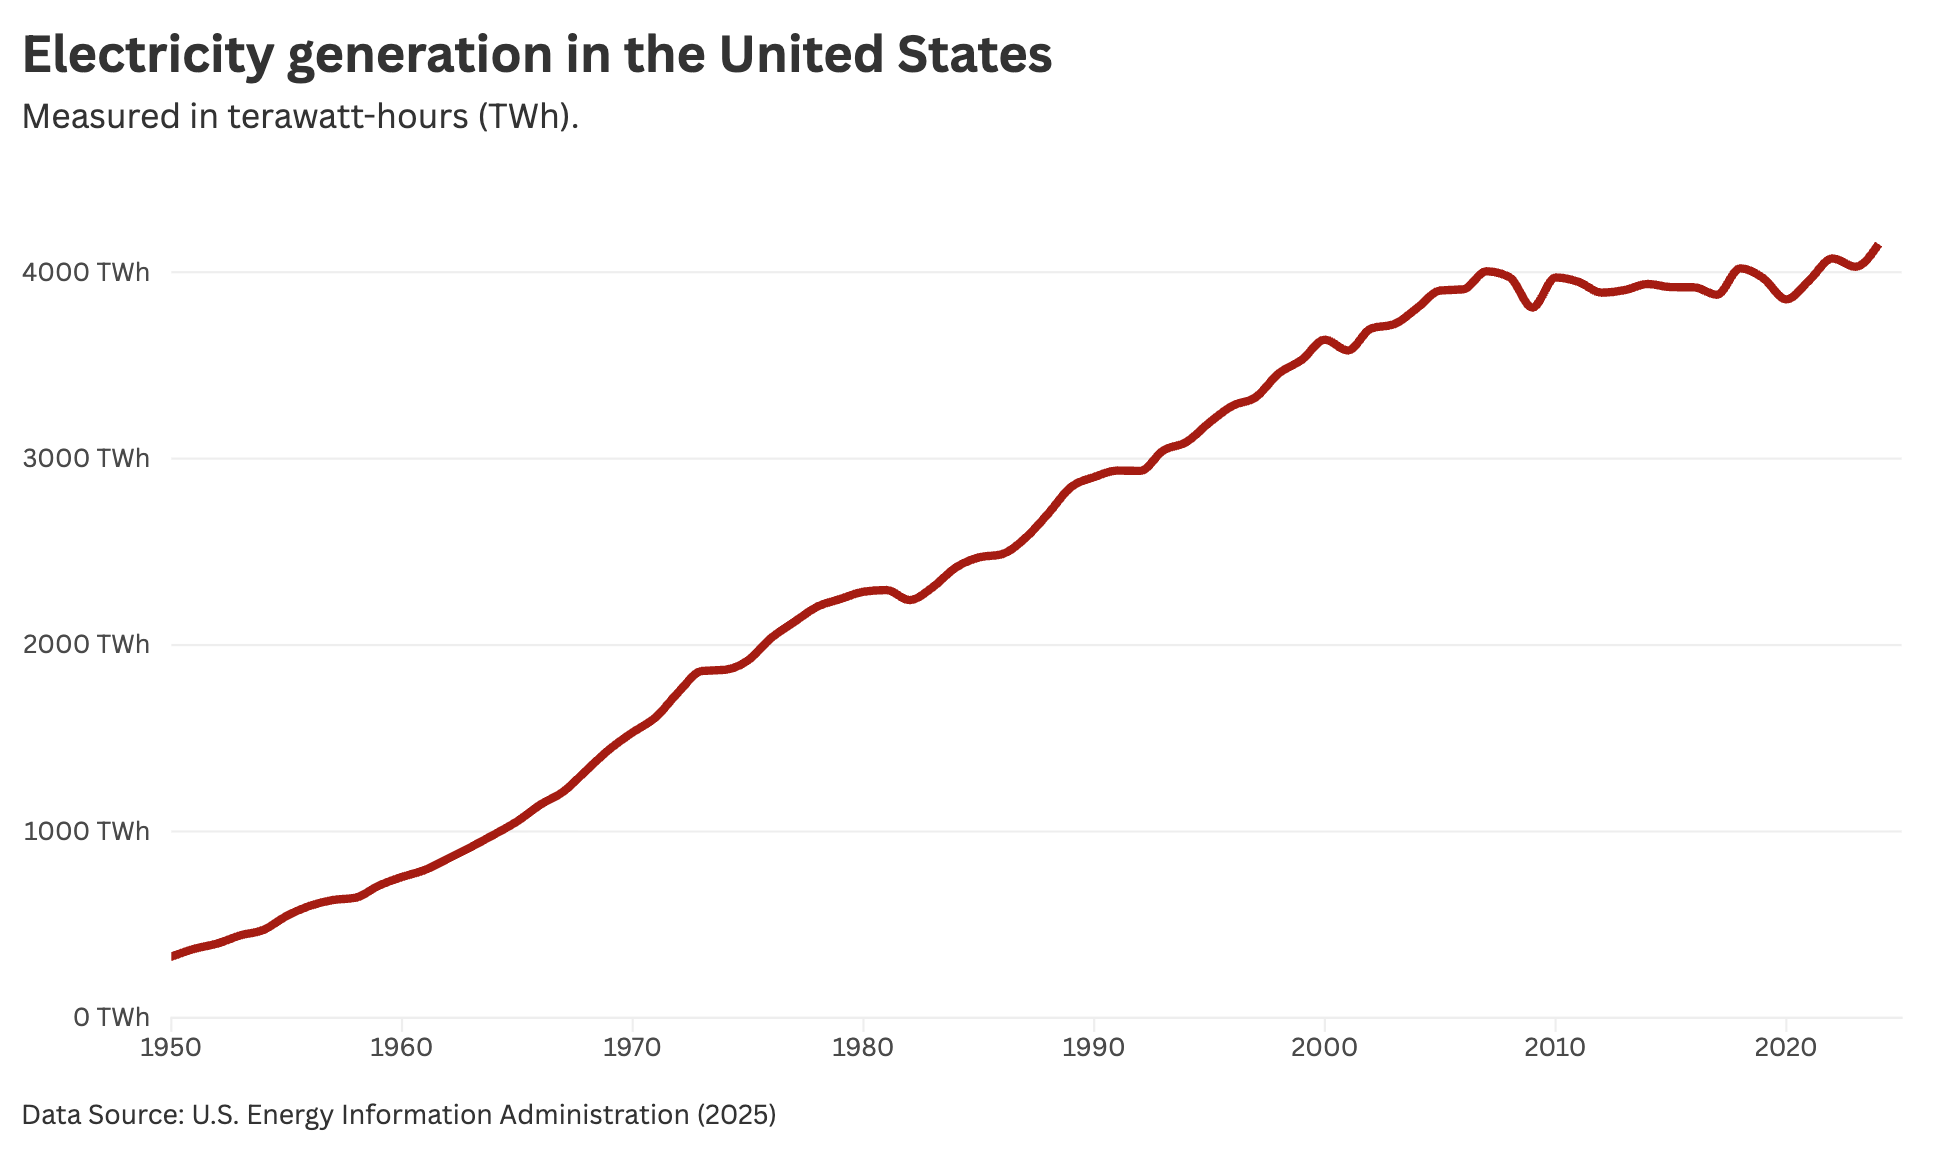
Below you can see electricity generation in the US stretching back to 1950. We shouldn’t really use “generation” and “demand” interchangeably. Demand can be higher or lower than what’s actually produced and available, which affects prices.
But it’s often hard to find projected and historical data that’s consistent in this regard. Or know what “demand” actually was in 1950 or 1960.
It had basically been flat since 2005, so for the last 15 to 20 years.1 But for the 50 years before then, electricity growth had been strong and fairly steady.
But what was the rate of growth throughout these decades, and how does that compare to modern and future growth?
Relative electricity generation since 1950
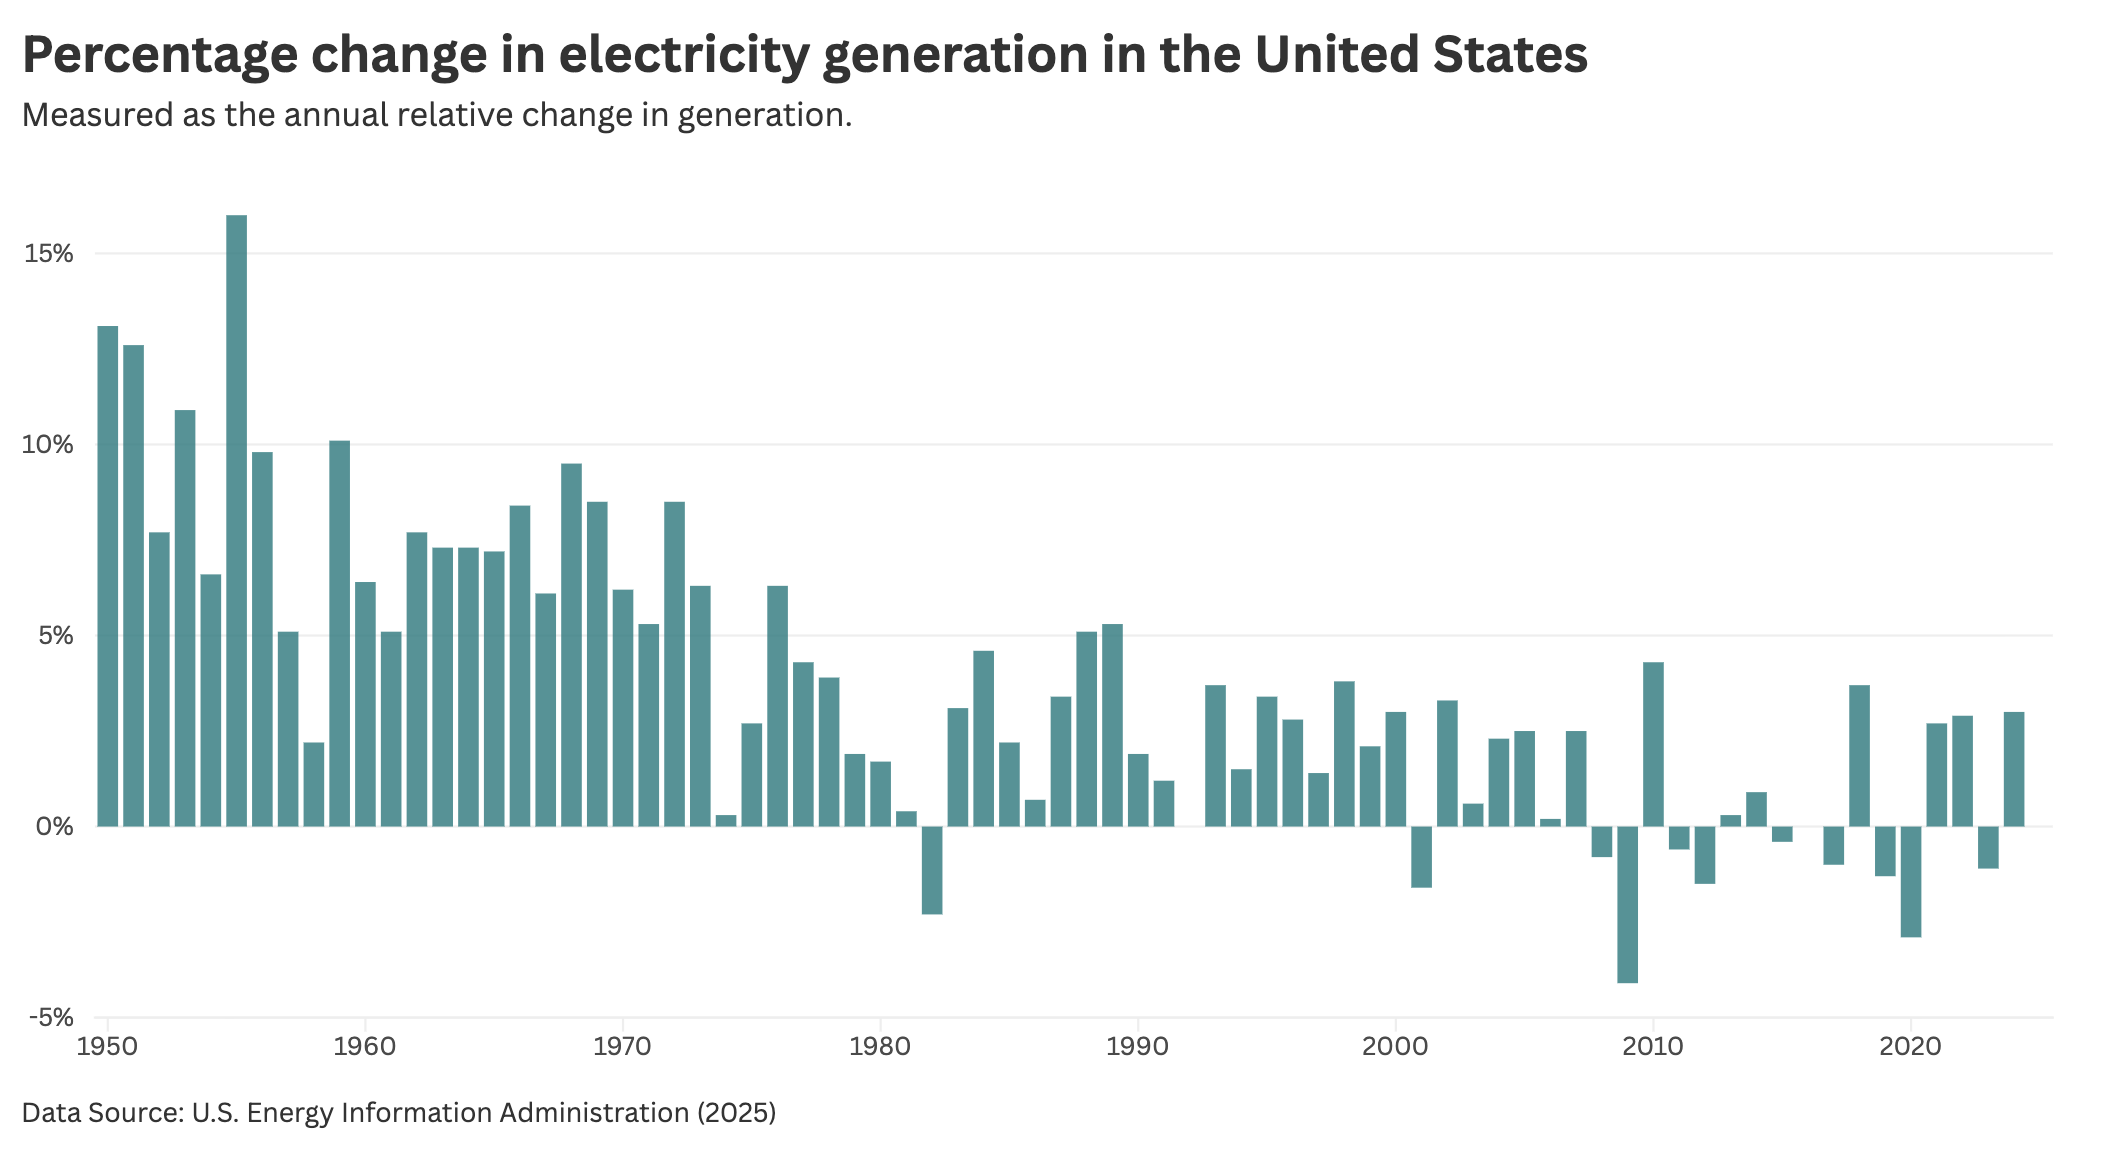
Let’s take the previous data and calculate the percentage growth rate each year. You can see the results in the chart below.
In the 1950s and 1960s, electricity generation was growing at more than 5% in most years, and often hitting close to (or over) 10%. Granted, this is starting from a very low “base”, which can make it easier to achieve higher percentage growth rates. When I published my second post on Substack, I increased my number of posts by 100%. I’d need to publish a lot more now to achieve the same 100% growth.
So don’t worry, we’ll also look at absolute growth rates soon.
In the 1970s and 1980s, rates dropped a bit, with most years in the 3% to 4% range. In the 1990s, they fell closer to 2%. And in the 2000s, there has been very little sustained growth: just volatile changes due to the 2008 financial crisis and COVID-19.
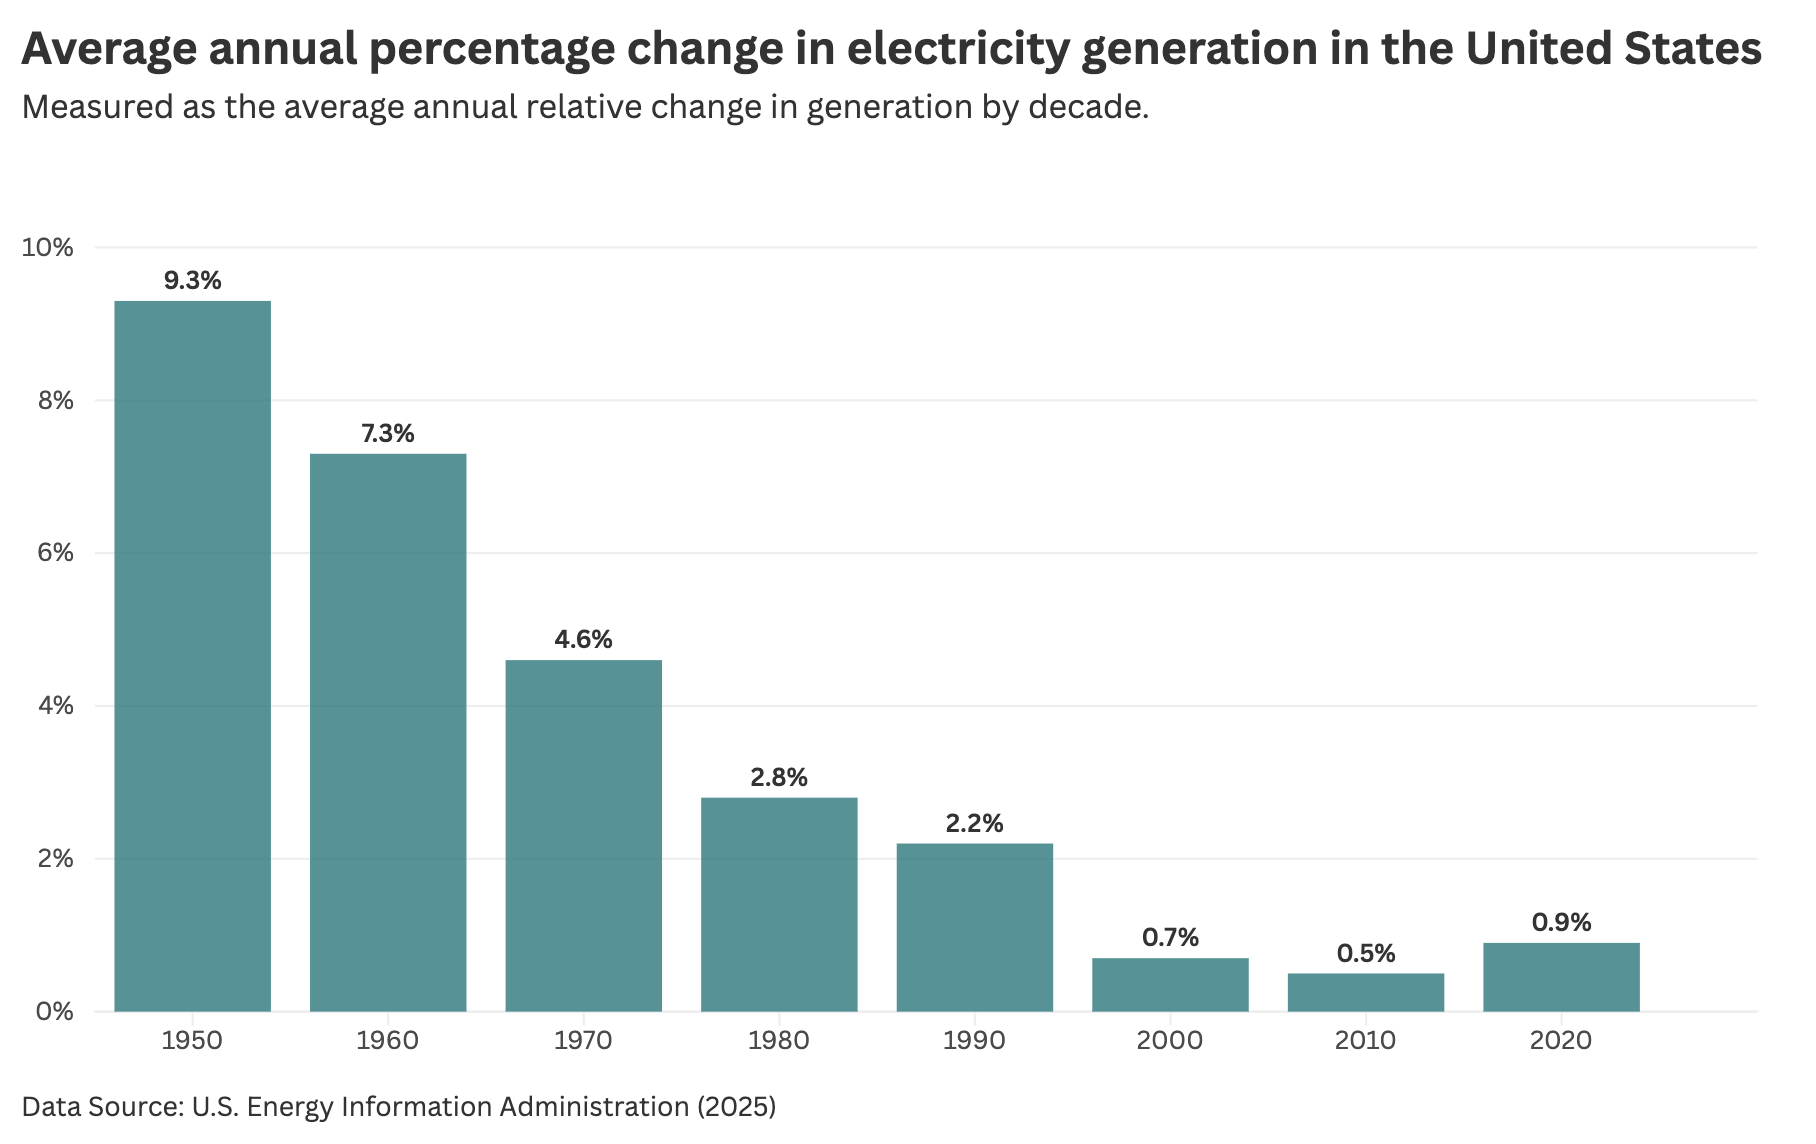
To simplify things, here is the same data presented as the annual average change per decade.
Now, remember the chart from McKinsey? It was projecting a 3.5% annual growth rate through to 2040. That would certainly be high compared to recent growth rates, but not unprecedented when we zoom out and look at growth rates in the mid-to-late 20th century.
Absolute electricity generation growth since 1950
Relative growth rates are useful, but don’t tell us how many additional units of electricity need to be generated. As the electricity grid expands, a constant percentage growth rate means you need to add more and more terawatt-hours each year.
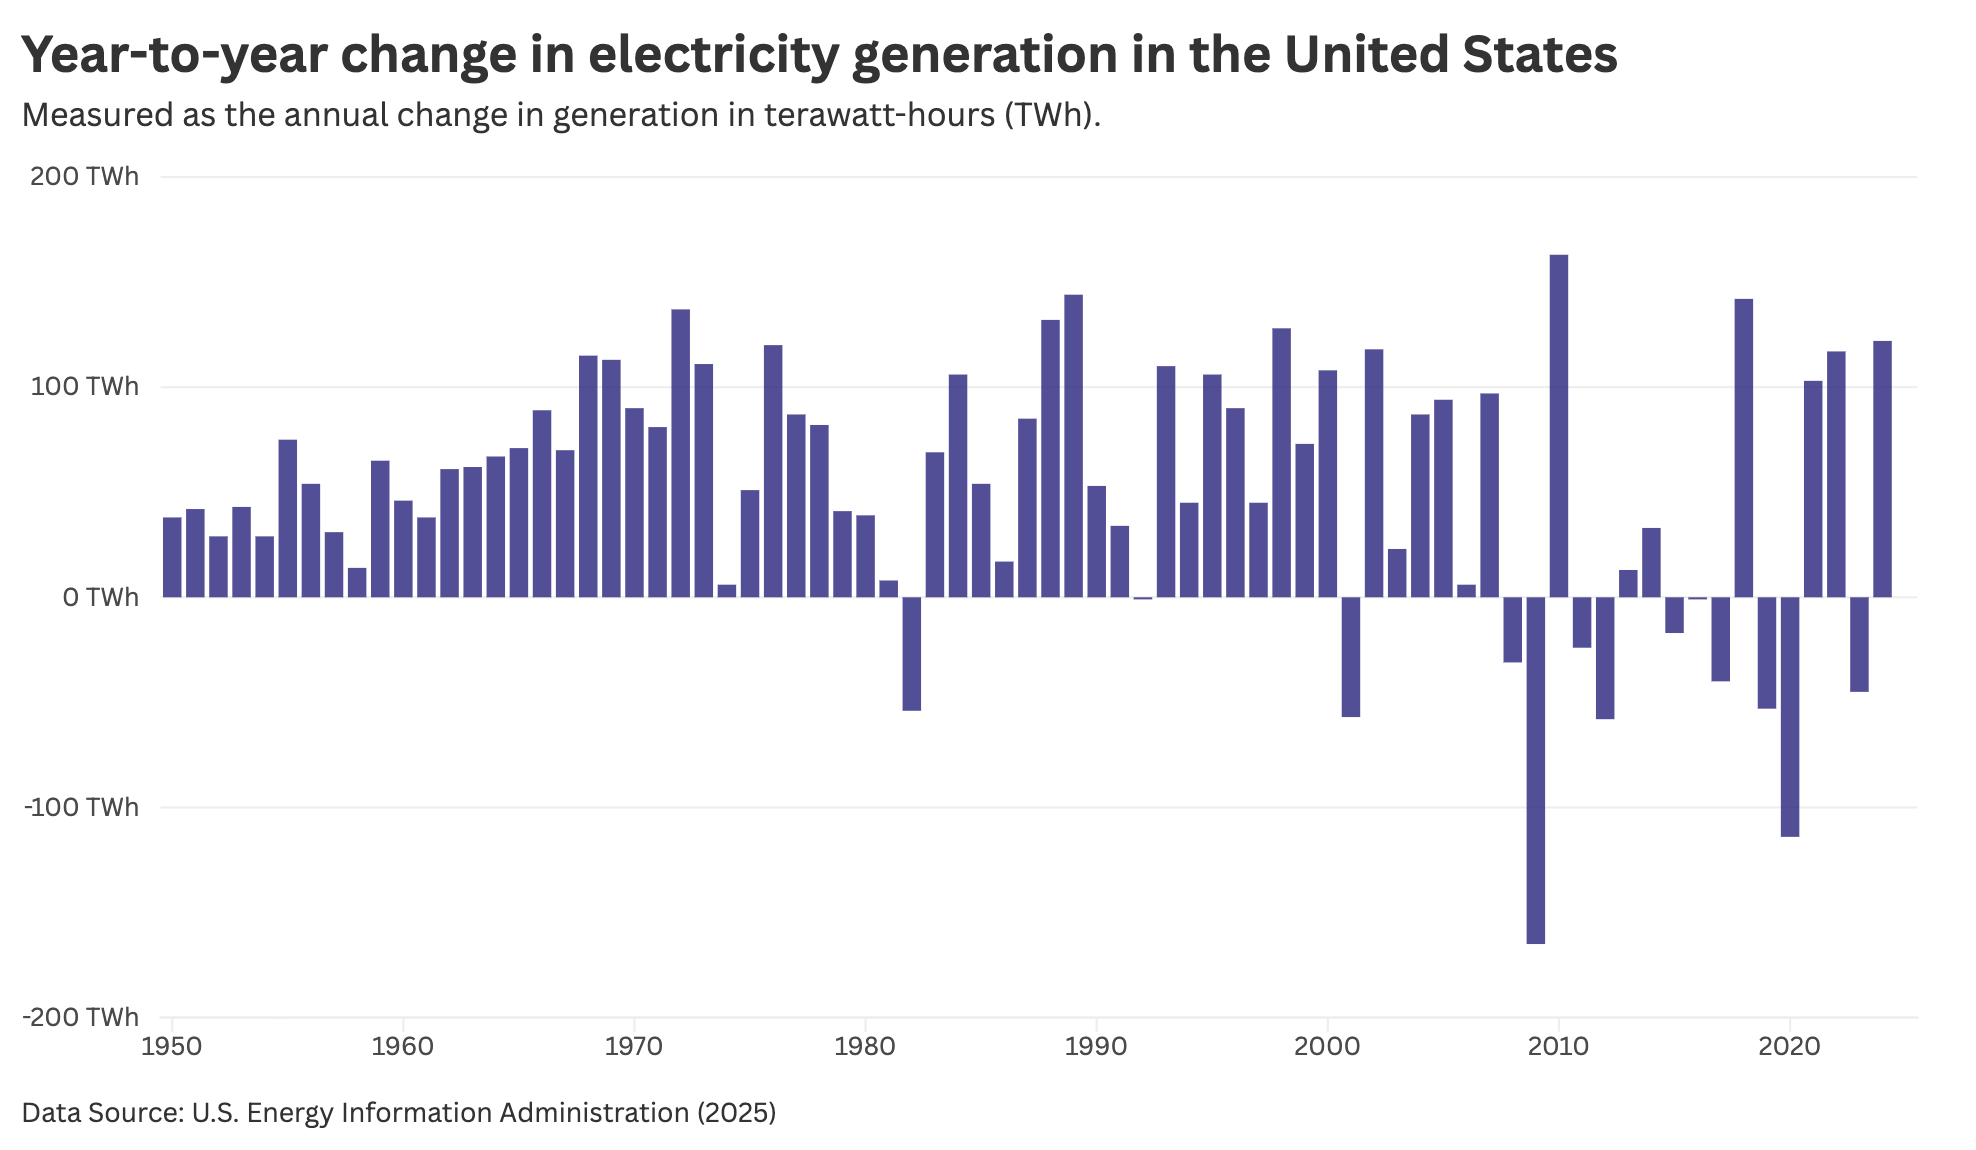
The chart here shows the annual change in terawatt-hours generated since 1950.
You can see that even for those 8% to 10% growth rates in the 1950s and 1960s, the US was “only” generating an extra 40 TWh per year. By the 1970s, 80s and 90s, it was adding closer to 100 TWh. Again, you can see the large swings in generation through the 2000s, but with little sustained increase (at least until the 2020s).
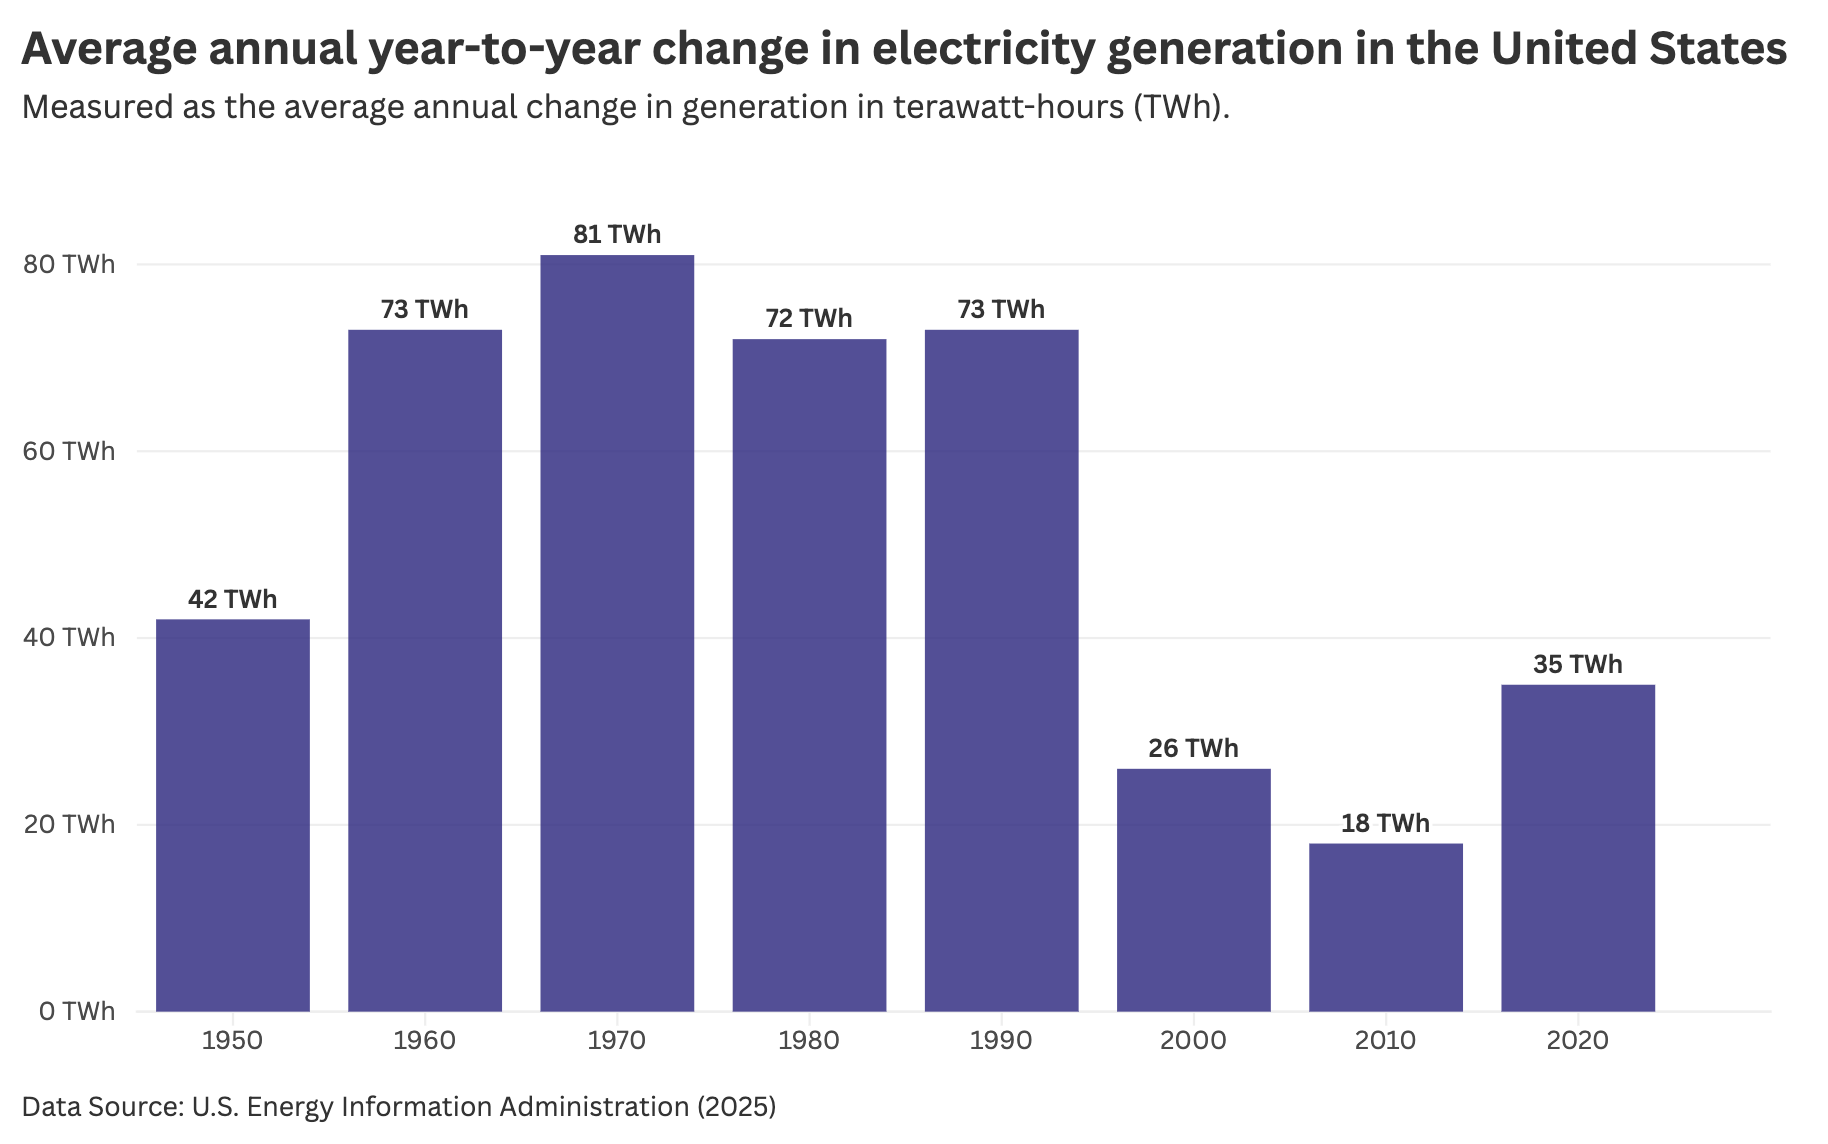
Again, here’s the annual change per decade, which gets rid of a lot of the noise.
Absolute growth reached its peak in the 1970s. But what’s interesting is how consistent the increase was in terawatt-hour terms throughout most of the late-20th century. This mirrors the line chart of electricity generation in the US from earlier, before the 2000s plateau; the line was remarkably straight and linear.
Short-term growth in electricity generation
So what about future growth?
Before we think about growth in the 2030s, it’s worth asking how “unprecedented” growth is in 2025 and next year. We already hear a lot about how grids are struggling to cope. That is not just an issue of total electricity generation keeping up with demand, but also a matter of very localised grid pressure (which often happens with data centres, because demand is so geographically concentrated), transmission, and other grid factors.
But given the historical data, is short-term growth a huge step up? No, not at all.
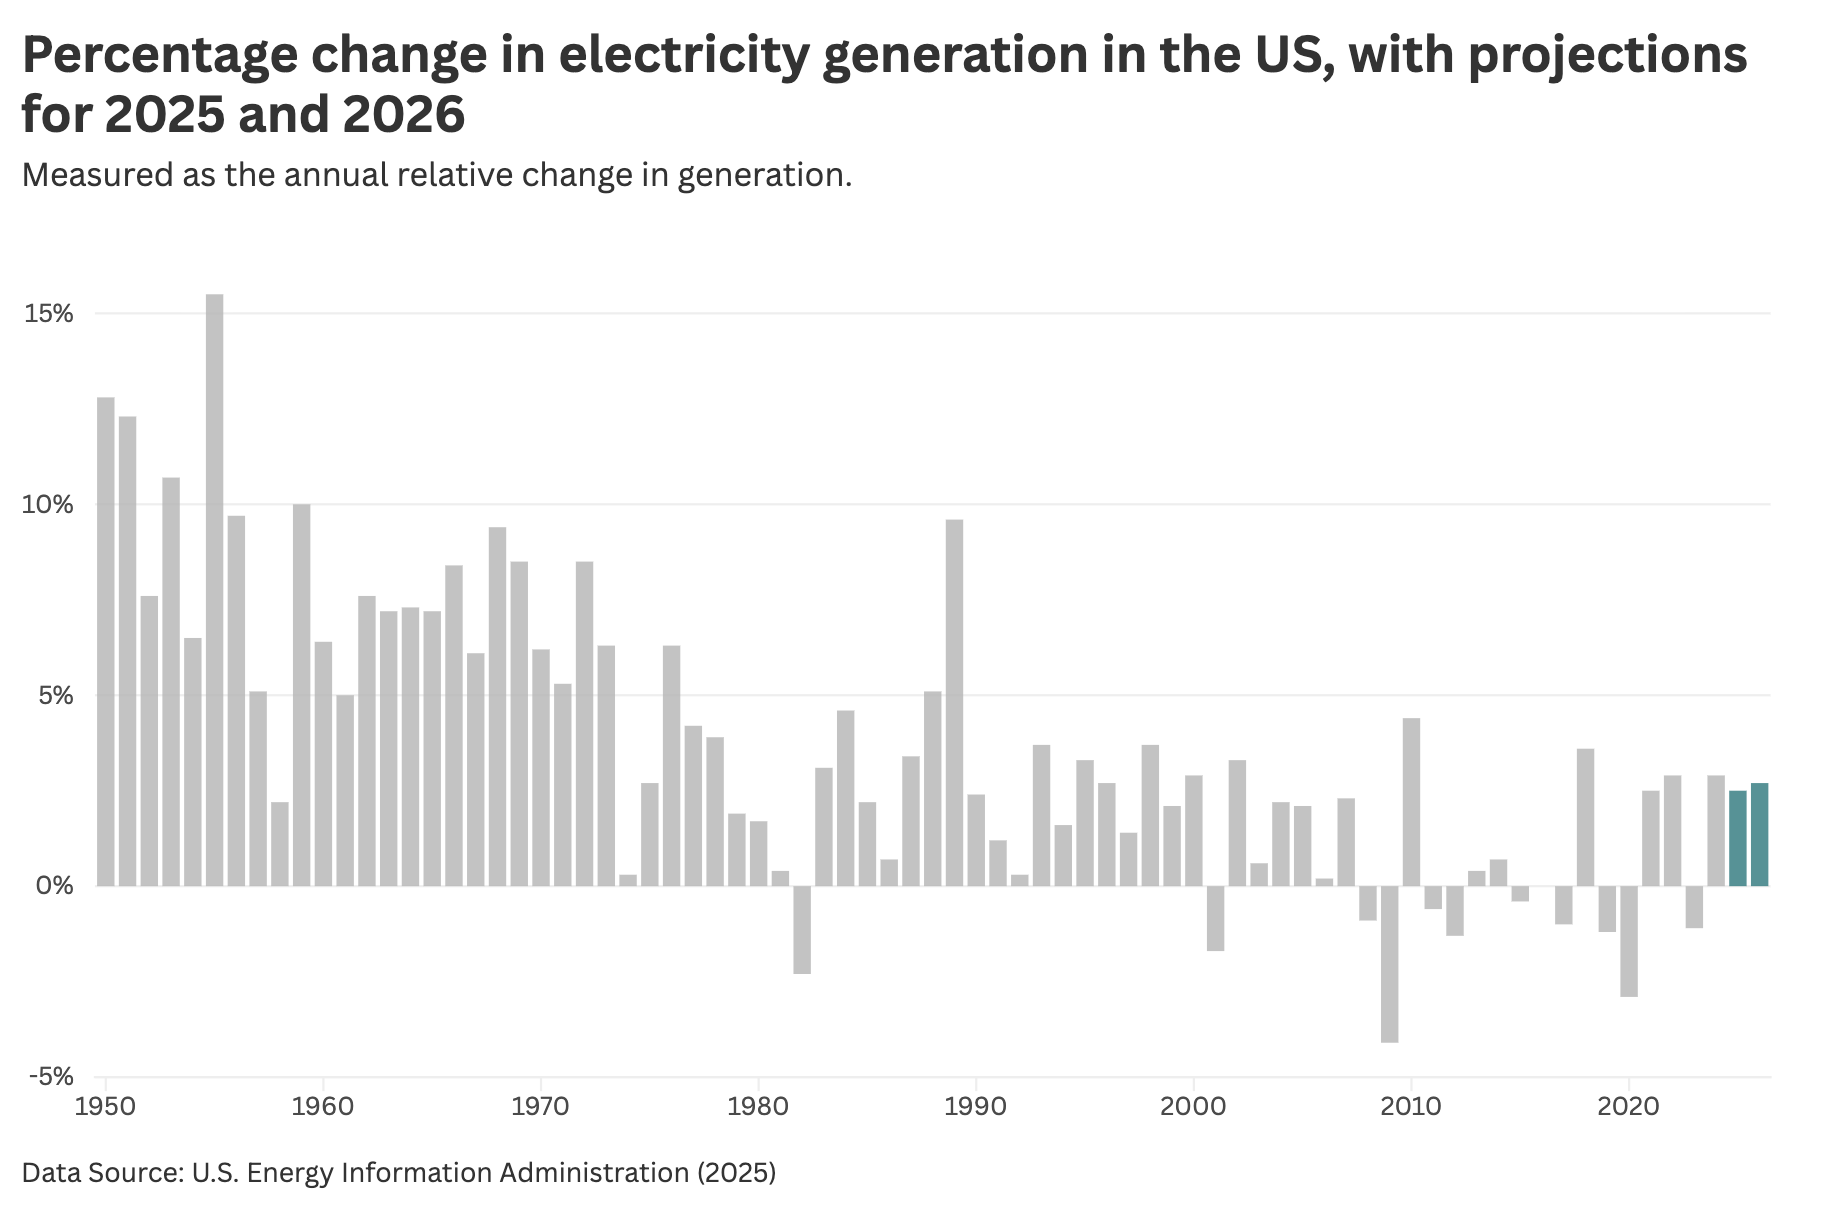
In the chart below, I’ve shown the percentage change and added projections for 2025 and 2026. These projections come from the US Energy Information Administration (EIA), and were published earlier this month, so they should be up-to-date.
Electricity generation is projected to grow by 2.5% in 2025 and 2.7% in 2026. The COVID fall and recovery make the “average” for the 2020s not that helpful. But these rates are pretty in line with growth in 2022 and 2024.
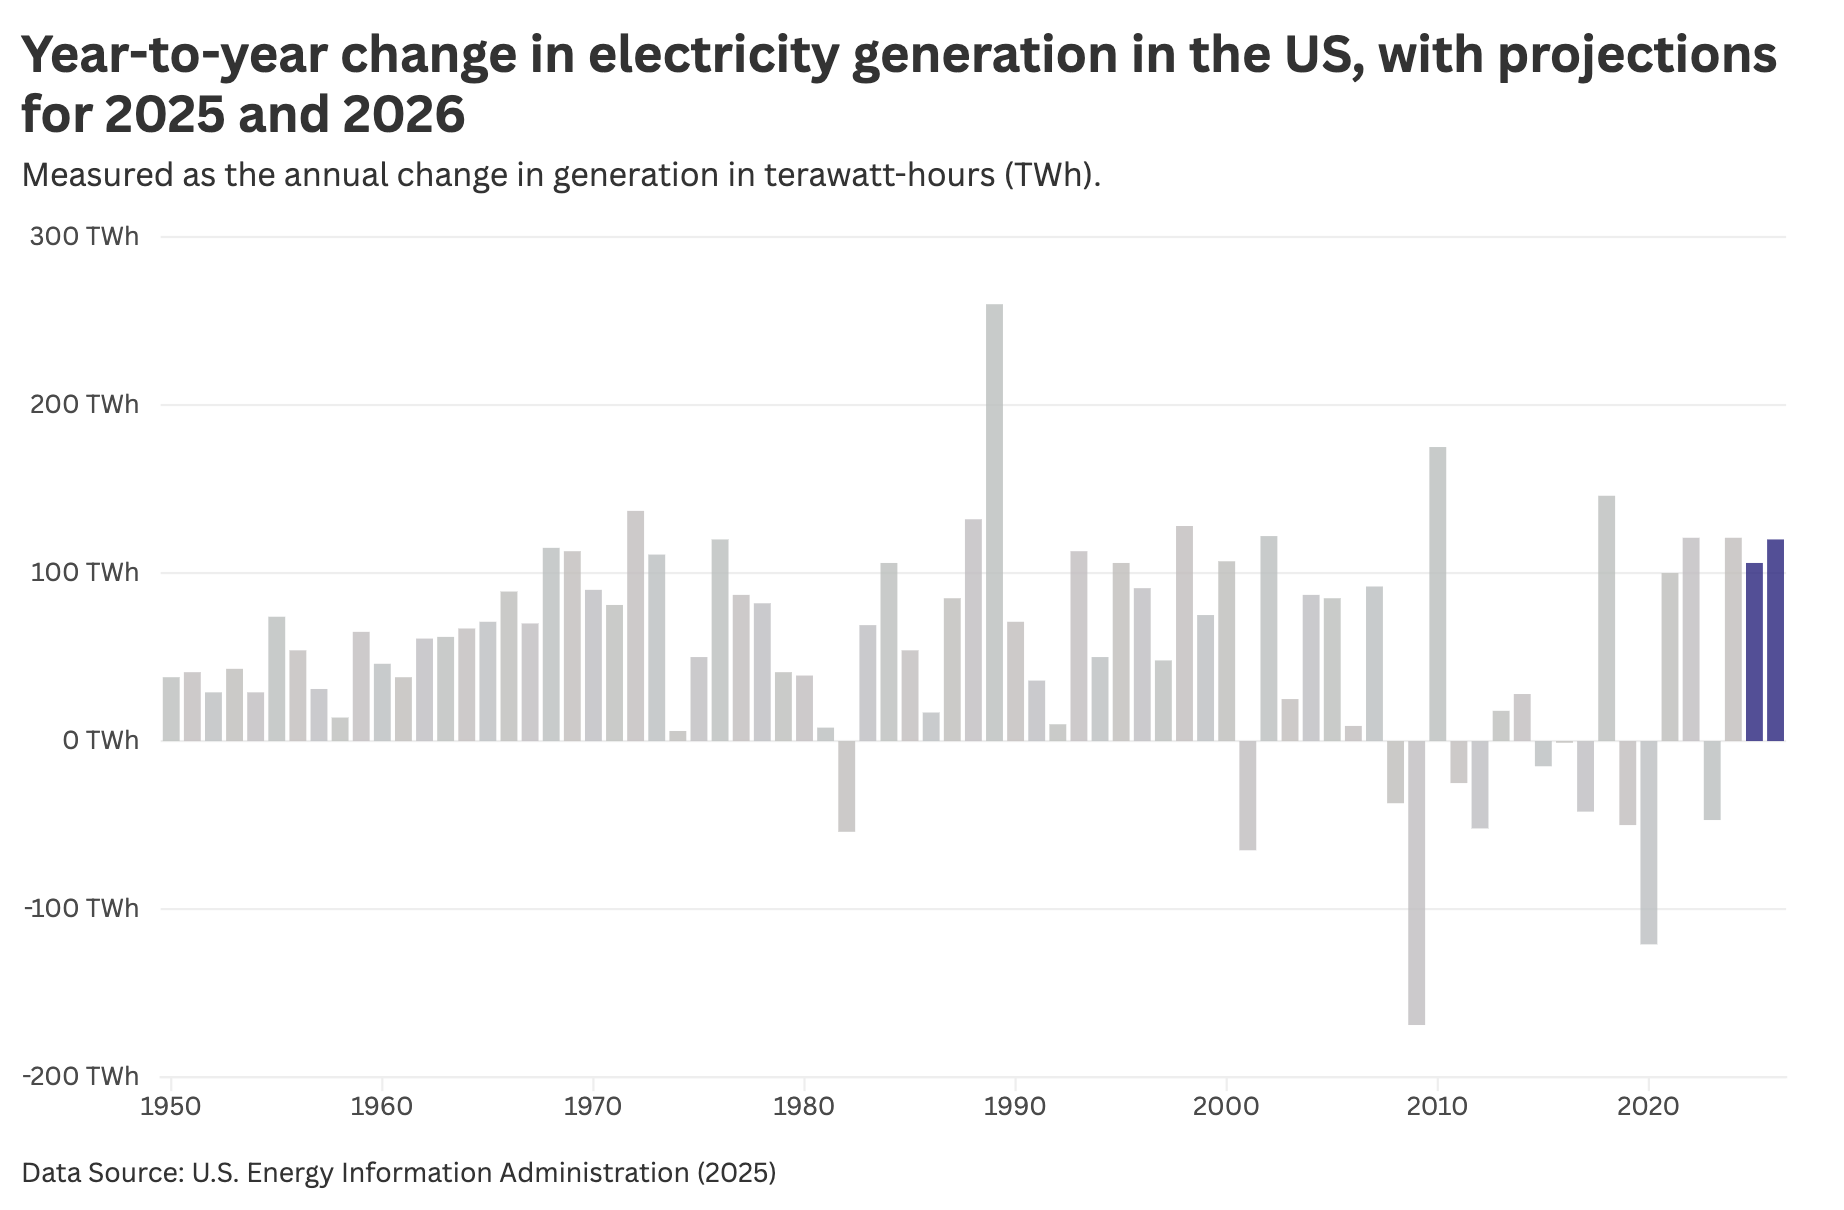
Here’s the same data in absolute terms. The takeaway is similar. The annual increase is around 100 TWh. That’s relatively large by historical standards, but again, not unprecedented. There were several years in the 1970s, 1980s, and 1990s that had the same.
Again, we should be careful about conflating generation with demand. It could be the case that demand growth really is huge, and generation simply can’t keep up.
Will electricity growth “skyrocket” in the late 2020s and 2030s?
Finally, let’s examine the projected growth rates from McKinsey from earlier and see how they’d look in a historical context. Remember, they were projecting a 3.5% annual growth rate from 2025 through to 2040.
We can add 3.5% for the 2030s in the chart below. The average for the 2020s is more complicated, as the first half of the decade has experienced much lower growth. Even the 2025 and 2026 projections from the EIA are below 3%. Even if growth in the last four years of the decade is high, the average is probably not going to be higher than 3%.
Again, the transition from no growth in the early 2000s to substantial growth in the 2020s and 2030s is a clear step change. But this growth is not unprecedented in relative terms when we look further back.
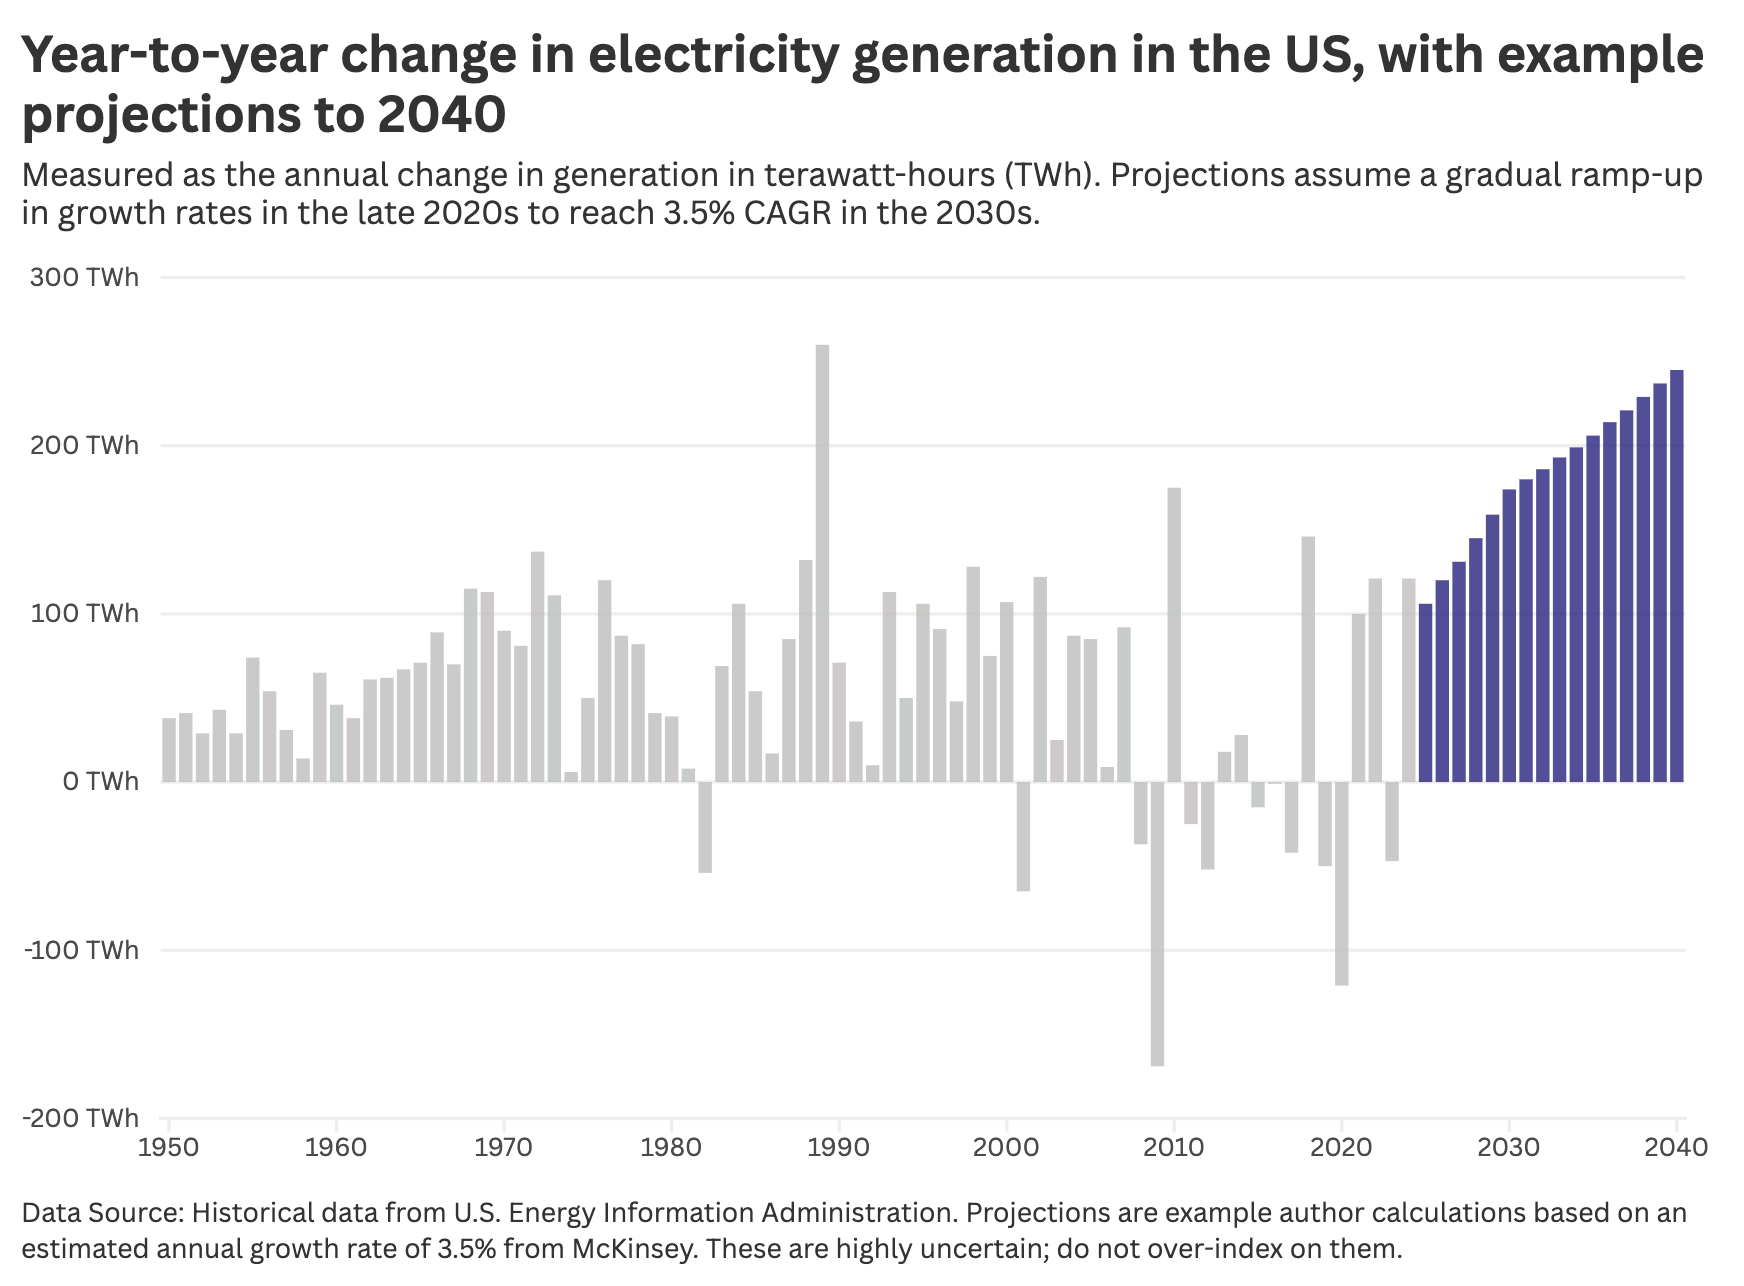
If these growth rates are correct, what would absolute growth look like?
Here’s a draft chart that gives some context. It’s oversimplified compared to the bumpy historical record, but I’ve assumed a ramp-up in relative growth rates to reach 3.5% by 2030, followed by 3.5% growth every year thereafter.
There were certainly years in the past where the amount added in absolute terms was as high as it could be in the 2030s — over 150 TWh. But this was often the “recovery” from a major drop the year before, and there was never this level of sustained terawatt-hour growth.
From this absolute perspective, the US and other countries like it will enter a unique period of electricity growth. To add 150 to 250 TWh every year, America will need to build serious amounts of new power capacity, and it will need to do so quickly.
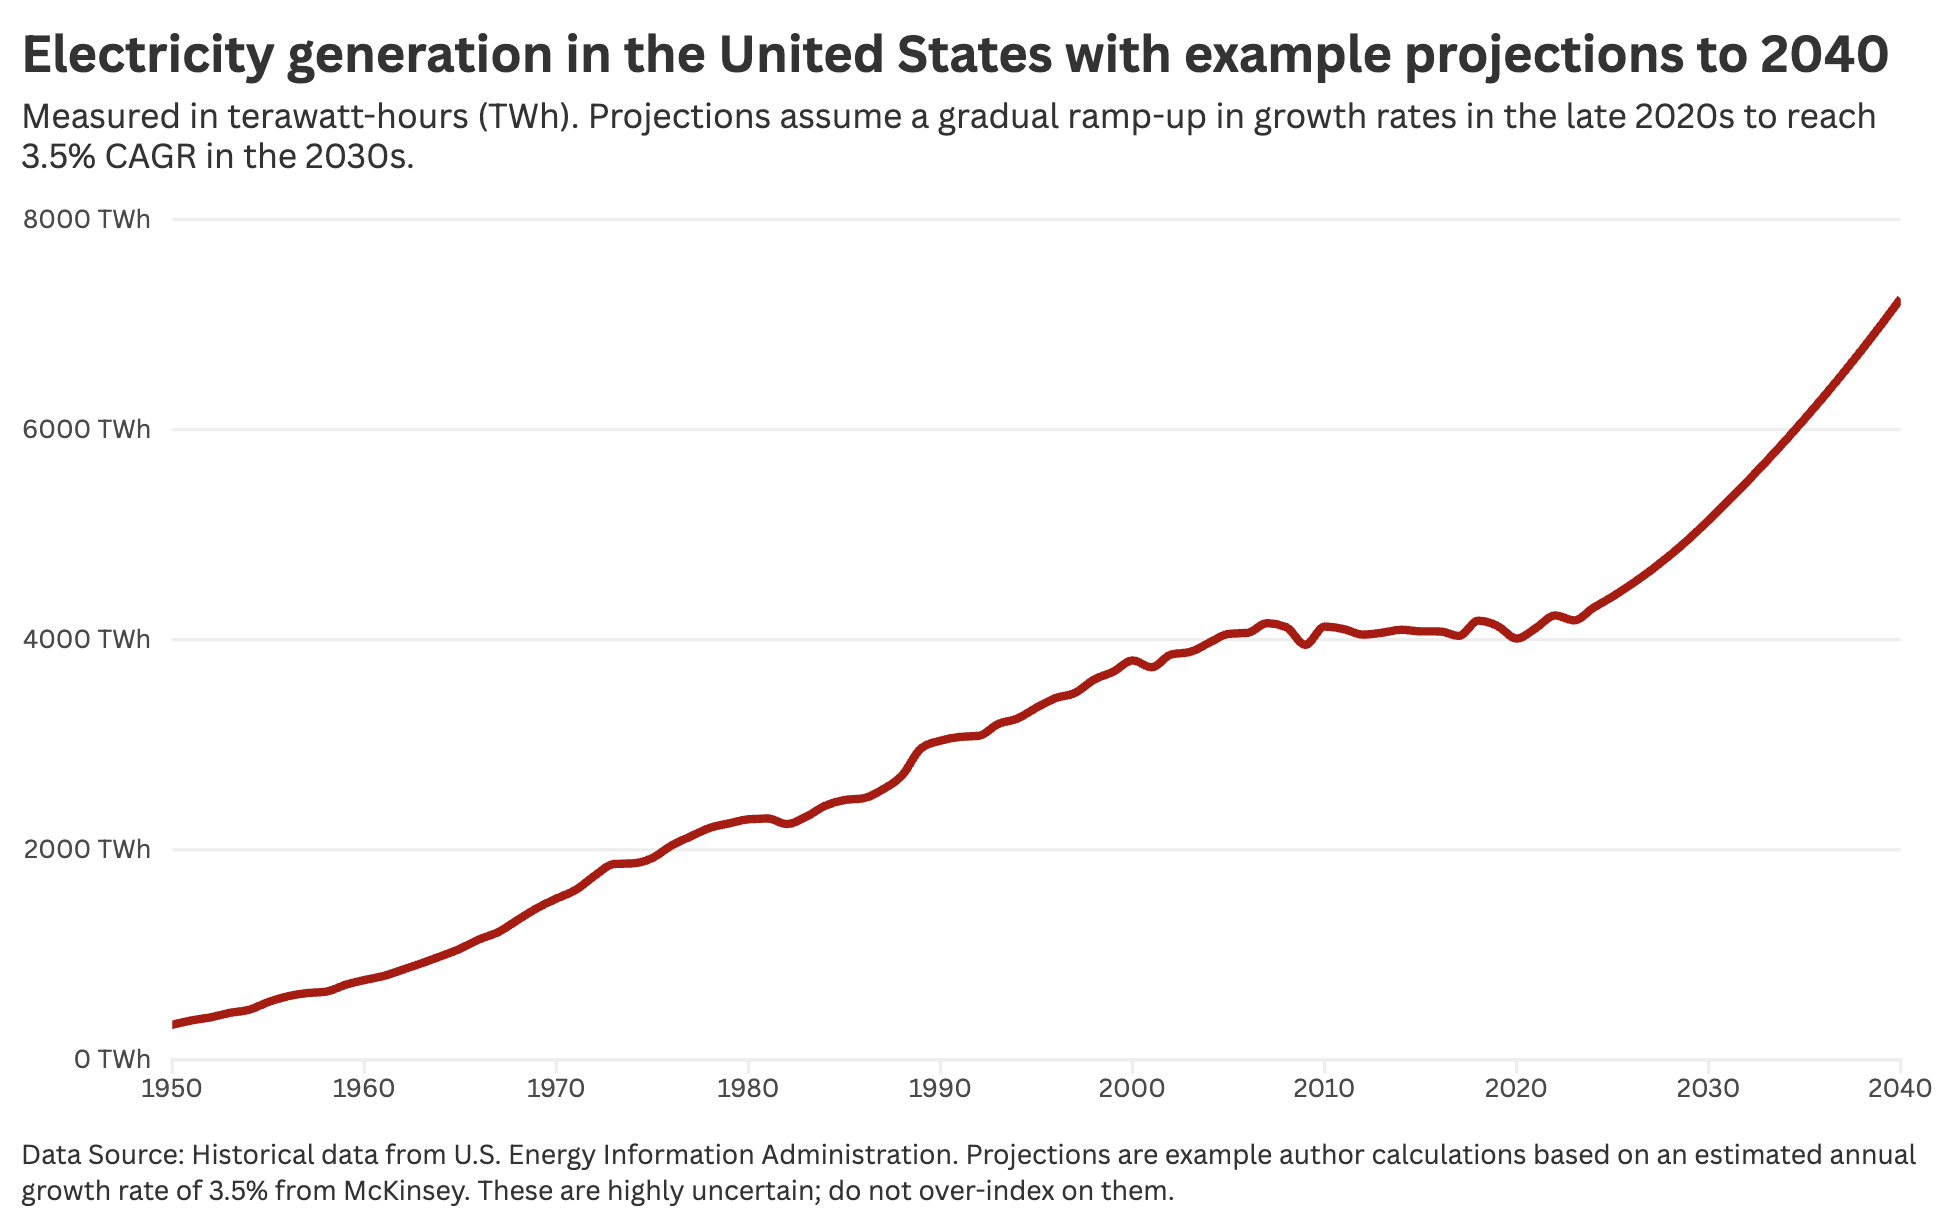
If you’re curious about what this would look like on a chart of historical electricity generation in the US, here it is. Again, the future period is too smooth and exact growth rates are uncertain. But it gives some perspective on what a century of electricity growth in the US might look like.
Interestingly, that means electricity use per person has fallen a bit.
Great analysis as always! Good to have a reference point when the word "unprecedented" is such a frequent occurrence these days lol. Even if this growth rate is relatively normal by historical standards, though, I think we're up against a VERY different permitting / RTO environment. With grid operators like PJM taking an average of 5 years to approve new generation, we're filling the grid with a very small bucket (even if there's an ocean of power in the grid backlog that could be brought online - 1 TW plus, though not all backlog projects actually make it online).
Thank you Hannah. As always, you cut through the clickbate headlines with your thorough analysis.
Alongside historical context, the context of "we should expect to see growth in electricity use as we reduce the use of hydrocarbons" is a particularly important one that we should bear in mind when reading these headlines.