Which countries have ‘enough’ public chargers for electric cars?
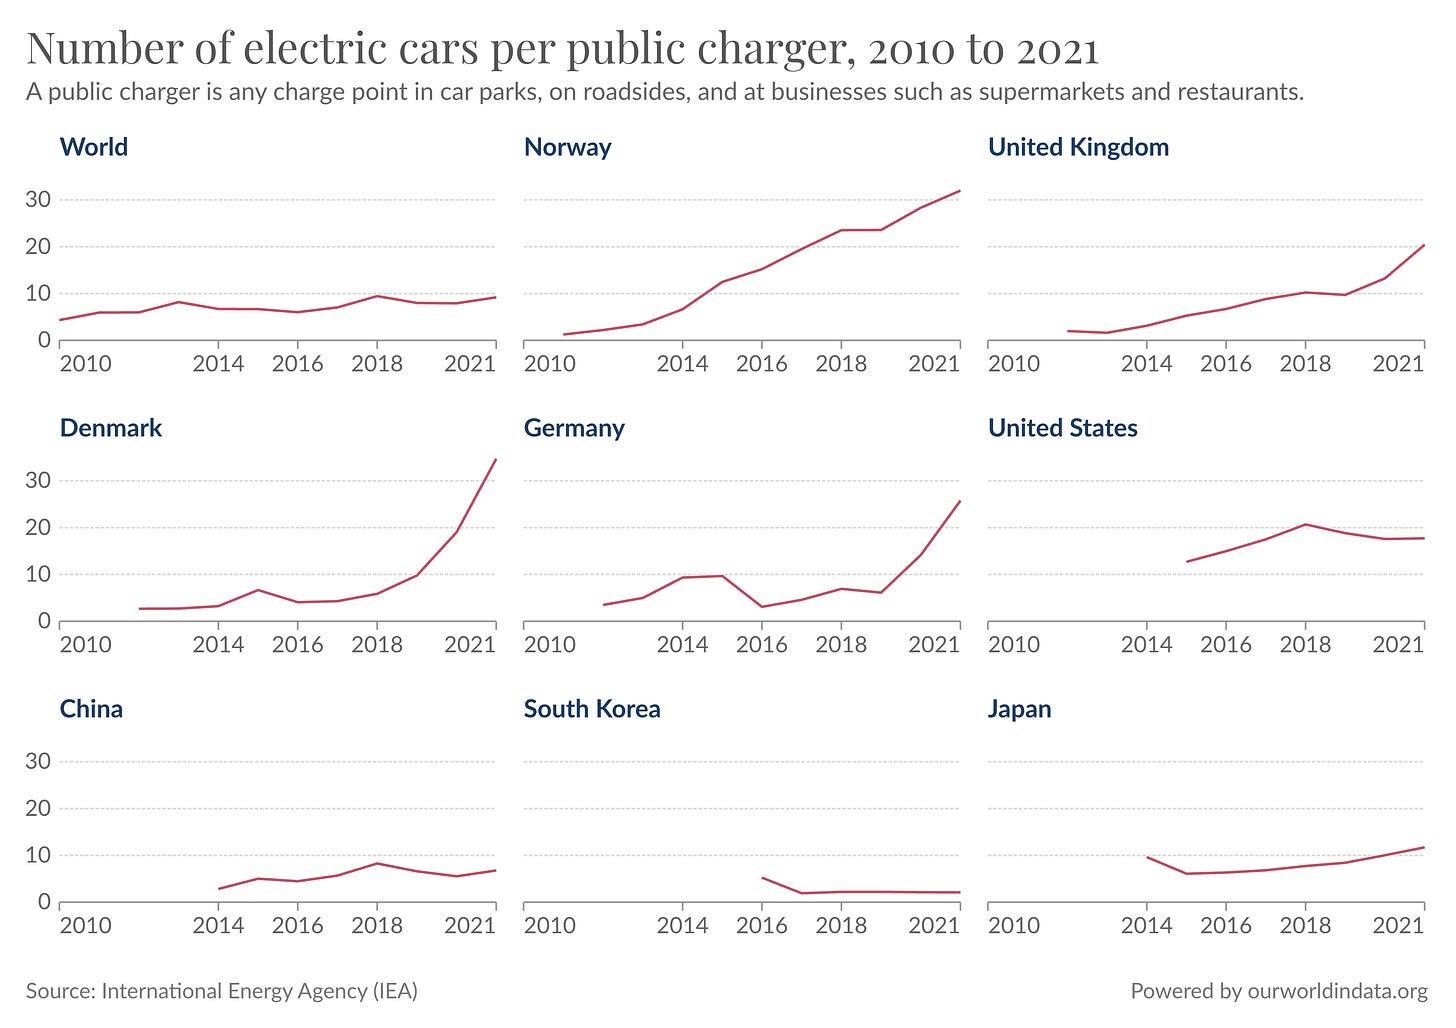
Globally, there are around 10 electric cars per public charger. But many countries in Europe have much fewer public chargers.
The world needs to move from gasoline to electric cars.1
Whether electric vehicles (EVs) can travel far enough on a single charge – their ‘range’ – is one anxiety that people have. In another article I show that in just a decade the average range of EVs has tripled and for most drivers, ‘range’ is really not a problem anymore.
A related concern is whether countries have the infrastructure to handle a boom in EVs. People need somewhere to charge them. Have countries been able to deploy chargers fast enough to keep up with rising sales?
In this post, I look at how the availability of EV chargers across countries, and whether their infrastructure is falling behind.
Here’s the summary:
Globally, there are around 10 electric cars per public charger.
This is heavily weighted by China, which has around 7 per charger. Many countries in Europe have a much higher ratio.
The EV-to-charger ratio tends to rise with time; countries need some public infrastructure to get started, but EV sales then outpace a rise in public chargers.
The demand for public chargers can be reduced by using “fast” chargers, which can refuel a car in as little as 30 minutes but usually in a few hours. That’s much quicker than a typical “slow” charger which takes 8 to 12 hours.
It’s hard to define which countries have ‘enough’ public chargers. It depends on context: how many fast chargers they have; the density of its cities; how many people live in flats without a driveway for at-home charging; or commuters that charge their EVs at work.
Globally, public chargers have roughly kept pace with the rise of EVs
First, we need some basic definitions. There are a few ways that people charge their EVs. A lot of people charge their car at home; a bit like you’d charge a laptop or a phone (but obviously using a lot more electricity).
Others use private chargers at their workplace or a similar location where users are limited to a select group.
The final option is to use a public charger. These are charge points that you’d find in car parks, along roadsides, at service stations and businesses such as supermarkets and restaurants. Anyone can use them.
Here we’re going to focus on public charging points. Data is limited on how many people are using at-home and workplace charging instead.
When I say ‘charging points’ I’m talking about the number of sockets that can charge vehicles at the same time. I’m not talking about charging locations or stations, which can have many sockets to charge from.
Let’s then look at public chargers at a global level.
They are being deployed quickly. In 2021 there were 1.8 million public chargers, which is a doubling from just two years before.2 We see this growth in the chart below.
Sales of EVs have also increased quickly over this time. In the two years from 2019 to 2021, the number of EVs on the road roughly doubled from 7.5 to 16 million.
This means the rollout of public chargers has just about kept pace with the rise of EVs. We can see this by looking at the number of electric cars per public charger, which is shown in the chart below. Over the past 5 years this has hovered around 8 to 10 EVs per public charger.
That’s a pretty good – and stable – ratio, but as we’ll see later not all countries have managed to keep pace.
Public chargers per electric car
Time to look at how this ratio of EVs to public chargers varies across the world. We see this data for 2021 in the chart below. Remember, the world average is 9.
Many countries have many more cars per charger. Denmark and Norway have more than 30. The UK has 20, and the US has 18.
In fact, most countries have a higher ratio than the global average. That’s because it is strongly influenced by China, which has a lower ratio of just 7.
South Korea is at the bottom of the list with just 2 cars per charger.
Are countries keeping up with growth in electric car sales?
These countries have not always had a high EV-to-charger ratio.
It’s common for countries to start with a very low ratio. Few people will buy an EV when there is no public infrastructure for it. Countries need to install some public chargers before people would consider buying an EV. In the early days, a country will have a good number of chargers before there are many EVs on the road.
But with time, car sales pick up and this ratio increases.
In the chart below we see the change in this ratio across different countries. In the bottom row we see that East Asian economies have managed to keep pace. China, South Korea and Japan have kept a low EV-to-charger ratio, below 10.
Contrast this with trends across Europe. In many European countries, this ratio has increased a lot in recent years. That means EV sales are outstripping the rise in charging points. We look later at whether this is a problem [unsurprisingly, it depends on the context].
The US has had a fairly consistent ratio over the last years, although more than 50% higher than the global average.
Here, it’s important to note that Europe is moving to EVs more quickly than the US and most countries in East Asia [China is one exception where its EV market is moving fast]. In 2021, 86% of new cars sold in Norway were electric. In the UK this was 18%, and 26% in Germany. In the US, it was less than 5%.
It’s easy to keep pace with EVs when you’re barely selling any.
Which countries are leading the way on fast-chargers?
The total number of public chargers gives us a good indication of the density and growth of EV infrastructure. But not all chargers are created equal. Some can charge your car in under an hour, others can take 12 hours or more to get a full charge.
The International Energy Agency (IEA) splits chargers into two types.
“Slow” chargers are rated as 22 kilowatts (kW) or less. These tend to take around 8 to 10 hours to charge, although lower-rated ones can take more than 12 hours.3 Slow chargers are ideal for drivers charging their cars overnight, or during the day while they’re at work. Slow charging tends to be cheaper, and most experts agree that long charging times – with less build-up of heat – tends to protect battery health.
“Fast” chargers are rated at more than 22 kW. Many can charge a car in just a few hours. Some rapid chargers can get a car to 80% in under 30 minutes. Fast chargers obviously have a lot of benefits for public charging. For long journeys, people can fully charge their car during a hour-long rest stop. Or during a supermarket trip.
If your chargers are “fast” you should need fewer of them. Rather than one driver hogging the charger for 10 hours, they can charge their car in a few hours and make it available for the next driver.
Some countries are investing heavily in fast chargers, while others have barely any at all.
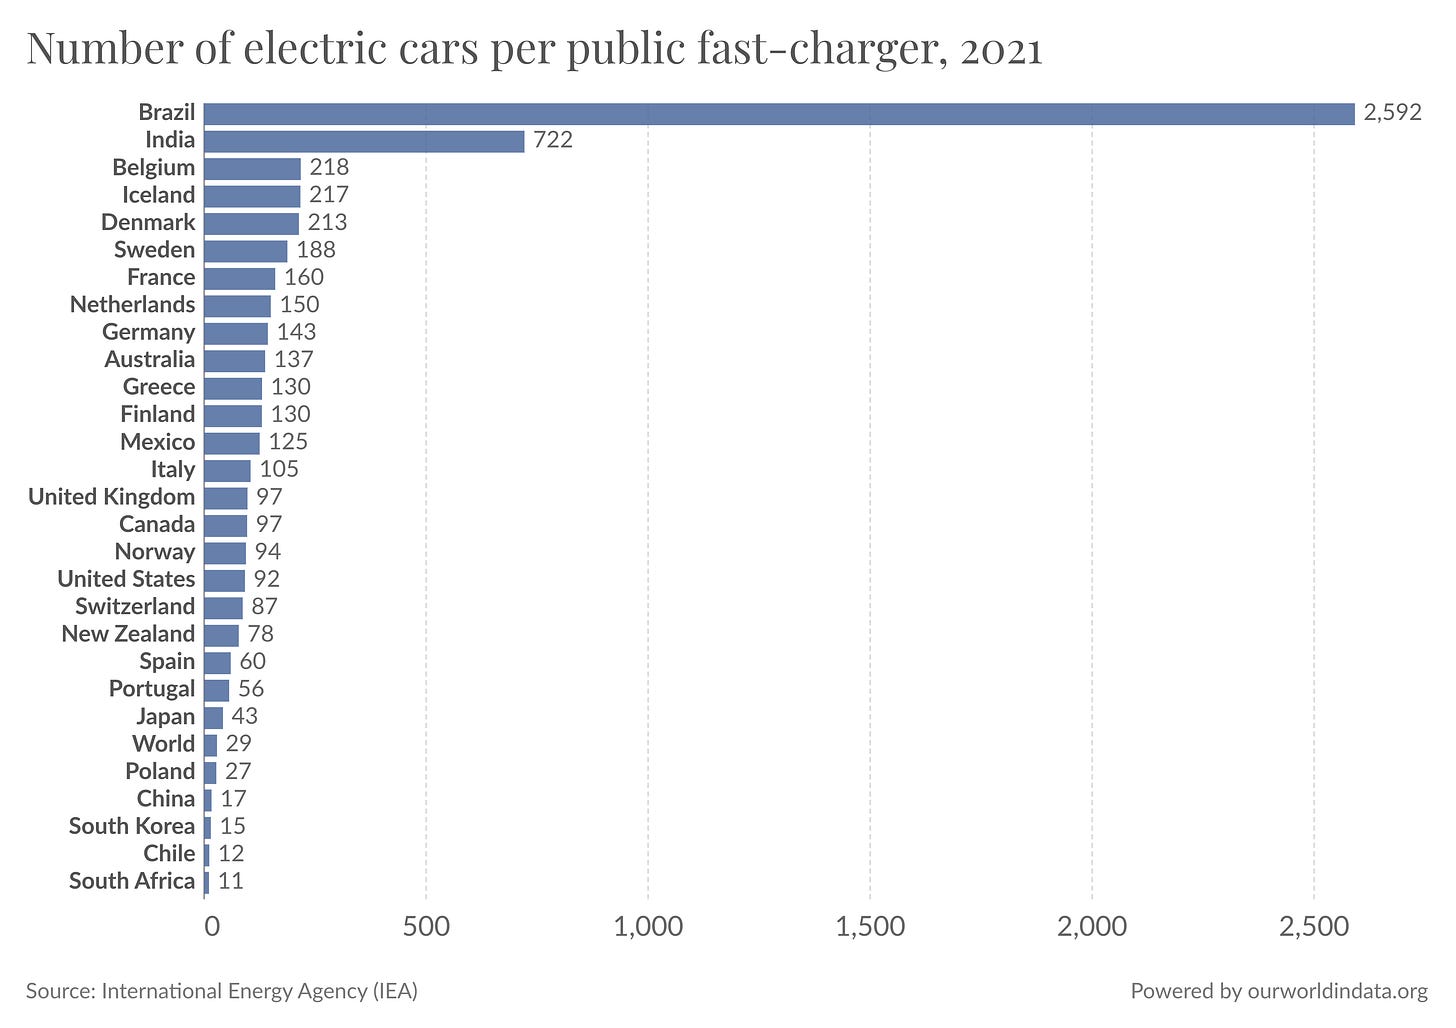
In the chart we see how many EVs there are per public fast charger.
Brazil and India are outliers at the top: they have almost no fast chargers yet.
Globally this ratio is around 30 EVs per fast charger. That’s around 3 times the ratio of total chargers, which means 1-in-3 chargers is a fast one [soon we’ll see that percentage is correct].
South Africa, Chile, South Korea and China are investing in fast-charging the most. Their ratios are all below the global average.
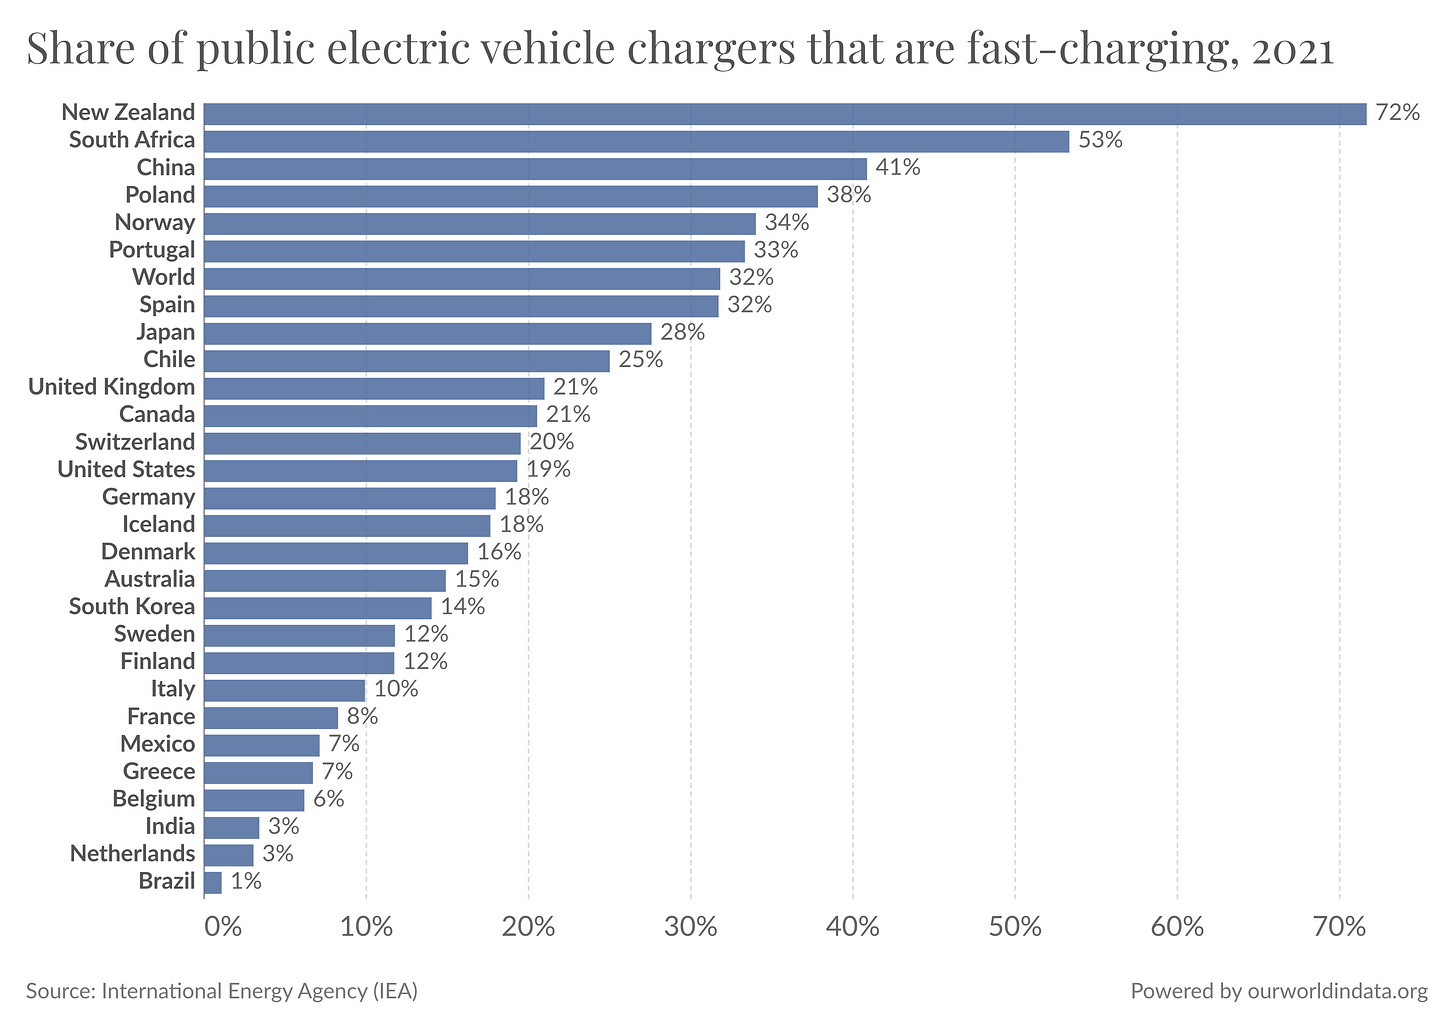
Another way to look at this data is to ask what percentage of public chargers are fast-charging. We see this across countries in the chart below.
Globally, as we estimated earlier, one-in-three chargers are fast. In 2021, more than 40% in China were fast-charging.
One-in-three chargers in Norway is fast, making it the European leader. That provides some counter to the rapid rise in EV-to-charger ratio that we saw earlier. A high EV-to-charger ratio is less of a problem if those chargers can refill three cars in the time it takes a standard charger to finish one.
In the United States and most countries across Europe, 10% to 20% of chargers are fast.
Finally, we can look at how the installation of fast and slow chargers is changing over time. Fast-chargers have only started to gain ground in the last few years. They were rare before 2019. But in many countries, they’re beginning to take hold.
They’re taking an increasing share of the total in China. South Africa – despite having a very small number of chargers overall – seems to be backing them heavily. The same is true of Norway.
The Dutch seem to be less keen, with fast-chargers still being only a 3% slice of the total.
These numbers are important. Countries with fewer fast chargers will need a better (lower) EV-to-charger ratio overall to provide the same quality of EV infrastructure.
Which countries have ‘enough’ EV charging stations?
It would be nice to give a definitive answer as to which countries have ‘enough’ chargers, and which are lagging behind. Unfortunately, this isn’t possible, at least not without some caveats.
The European Union did try to set a standard for the EV-to-charger ratio in 2014. In its Alternative Fuel Infrastructure Directive it recommended that all EU countries should have a ratio of less than 10.
That’s about the global average. China, South Korea and Japan would all meet this recommendation. But most countries in Europe don’t. As shown in the map below, only the Netherlands and Greece had a ratio less than 10 in 2021.
That would suggest that most of Europe does not have ‘enough’ public charging points. But this simple ratio misses some key context. The first is how many of those charging points are “fast”. Greece and the Netherlands might meet the EU recommendation based on total chargers, but they have barely any fast chargers. If your public chargers are all fast-charging you can maintain a much higher ratio and still have ‘enough’.
This ratio also takes no account of country’s geography, culture, and driving context. We can see how the demand for public chargers can vary so much by comparing cities across the world.
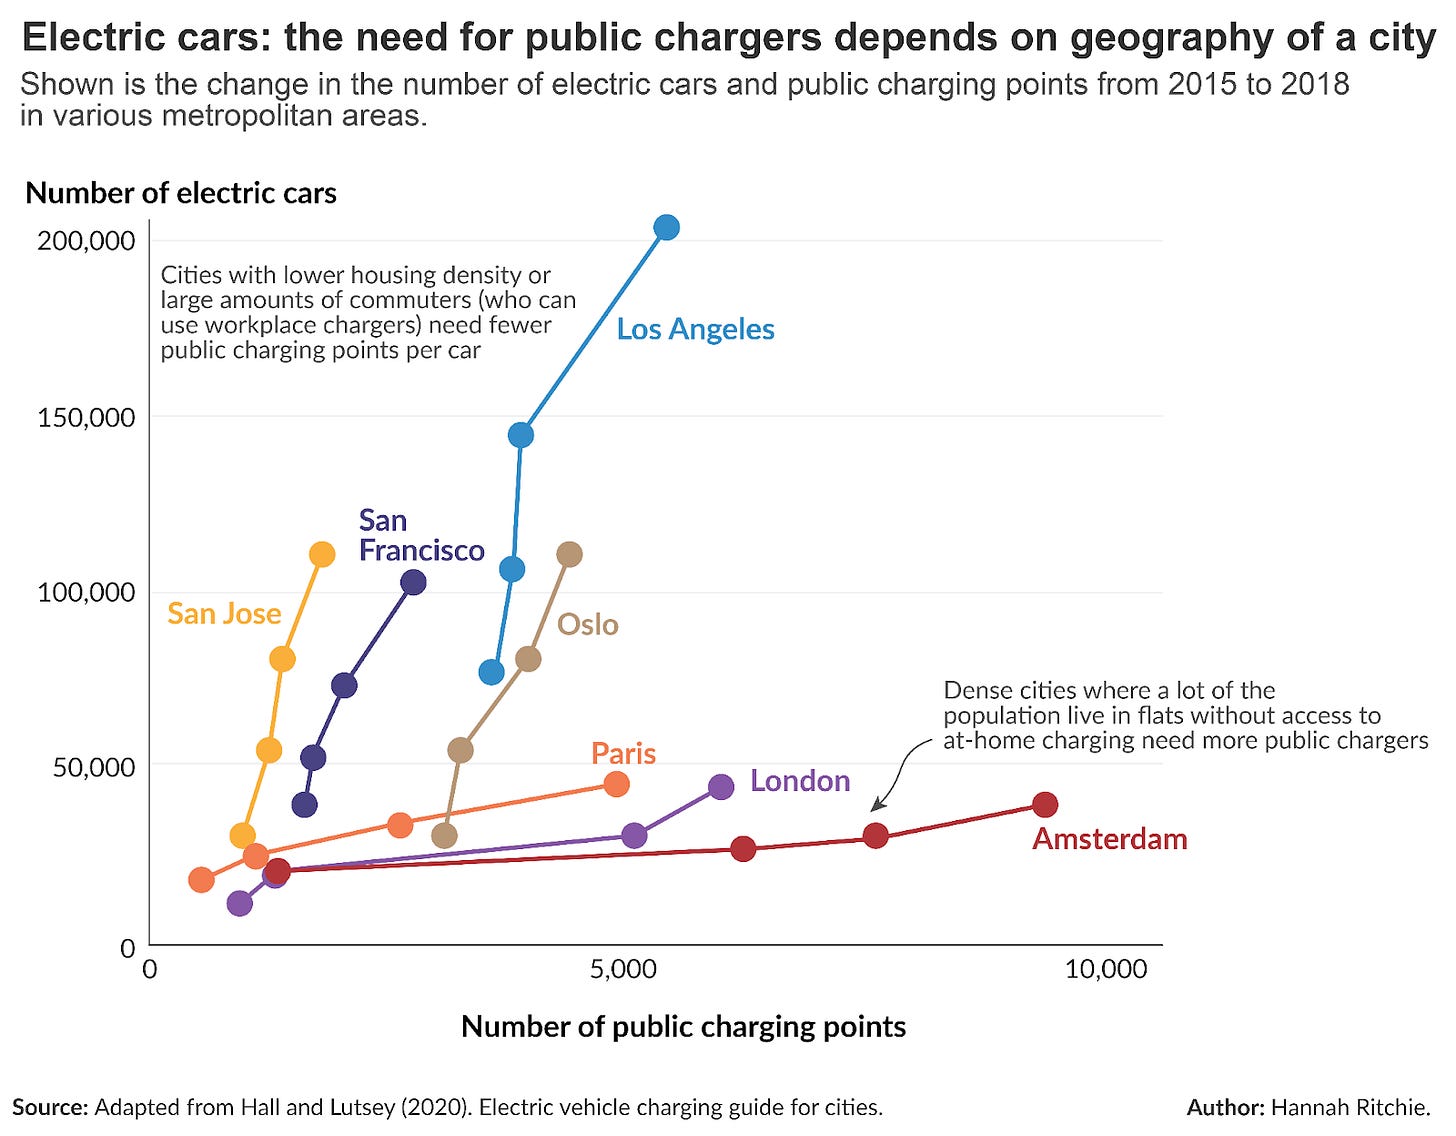
Researchers looked at how the number of EVs and public charging points changed across a variety of cities between 2015 to 2018.4 These are shown in the chart below.
When cities add more EVs, the line goes up, when they add more charging points, it goes right.
Cities have taken very different pathways. Many cities across the US, such as San Jose, San Francisco, and Los Angeles have added a lot of EVs without adding many more public chargers. That’s why the lines are going almost straight up.
This seems like a problem, but might not be. There are a few reasons for this. Many people in these cities live in houses with a garage, and driveway. They can charge their cars at home. They also use their cars to commute to work and a lot of their workplaces have charging points to use [in the additional information at the end I show that San Jose has a much higher workplace charger density than any other city in the US]. Most drivers charge their cars at home or at work so they don’t need public chargers by the roadside or in public car parks.
Contrast that with Amsterdam, London or Paris – high-density cities where many people live in flats without a garage or plug-point to charge at home. They’re also far less likely to use their EVs to commute to work; they cycle or take public transport instead. The demand for public chargers will be much higher. That’s why we see their lines moving to the right: they need to add a lot more charging points per EV on the road.
When it comes to having ‘enough’ chargers, context matters a lot.
What’s true of San Jose, San Francisco, and LA is probably true of the US more broadly. It has a lower geographical density, more suburban areas, and many more people drive a long way to get to work. At-home and workplace charging will be more popular, so the demand for public chargers might be lower. This at least applies to in-city infrastructure; the US might need more public chargers on highways since long-distance driving is more popular than in many European countries.
To understand whether countries and cities have sufficient charging infrastructure, we need to consider these chargers in the context of at-home and workplace charging. But this data is rarely available. That’s bad because it means governments can’t understand if there are large infrastructural gaps, and where they are.
As the world quickly moves towards EVs, this is more important than ever.
Additional information
San Jose, San Francisco, and Los Angeles have a lot more charge points at workplaces than other US cities. We see this in the chart below. This comes from the
ICCT’s report, 2021 briefing: Evaluating electric vehicle market growth across U.S. cities.
In another post I show that electric cars emit less than petrol or diesel even when we account for the production of the battery, and if the electricity mix is rich in coal.
I’ve calculated all of these metrics for public EV chargers using data from the International Energy Agency (IEA): https://www.iea.org/data-and-statistics/data-tools/global-ev-data-explorer
The actual charge time will depend on a number of factors, including the size of the battery, the rating of the charger, weather and temperature, and the health of the battery.
Dale Hall and Nic Lutsey (2020). Electric vehicle charging guide for cities. International Council on Clean Transportation (ICCT).


Checking in from NZ, which I saw at the top of the first graph! Has been a big upswing in the purchase of EV’s in the past few years, due partially to a “Clean Car Discount”, which was around NZ$8k off a new EV, and around NZ$3k off a used EV, which is funded by a “tax” on polluting vehicles, like Utes (trucks), which are insanely popular in NZ.
Thank you for writing this Hannah, excellent article. Please can I ask where Tesla stands in definitions of public chargers and EVs sold, Teslas operate ( for the most part) in their own micro climate for fast charging? I know there is crossover but Tesla owners seem to have a much different experience & I wondered if there’s enough data to see that in the numbers? (Someone is going to mention reliability...) Thank you again for your analysis.